
Black teachers: How to recruit them and make them stay

Lessons in higher education: What California can learn

Keeping California public university options open

Superintendents: Well-paid and walking away

The debt to degree connection

College in prison: How earning a degree can lead to a new life

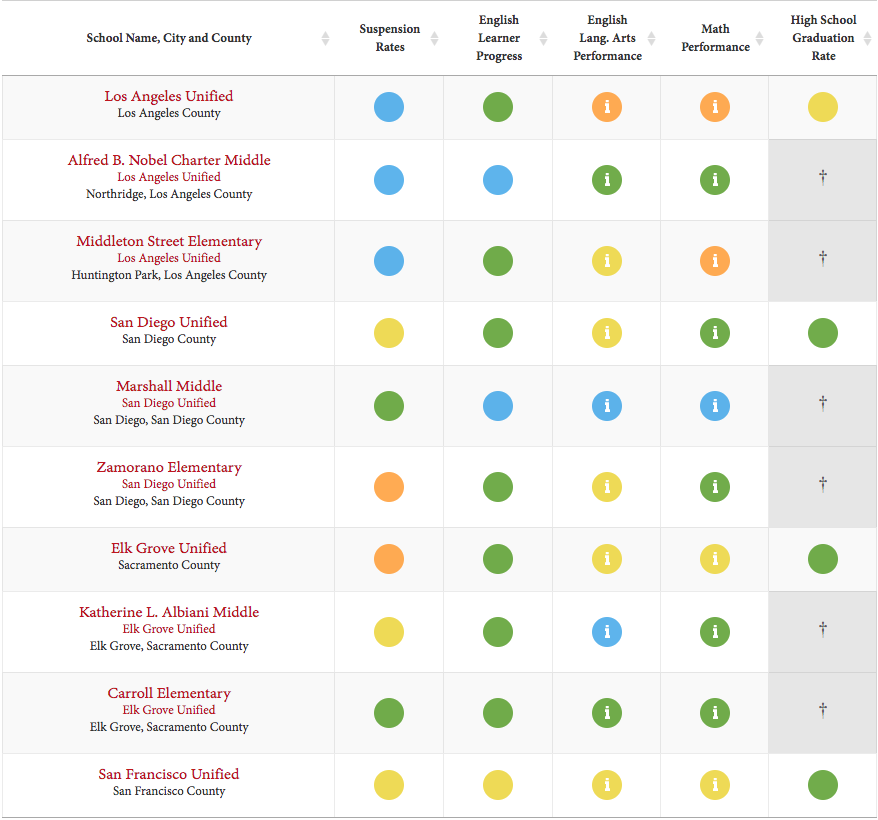
For the first time since 2019, the California Department of Education updated the dashboard that tracks the annual progress of K-12 students on factors such as standardized test scores, chronic absenteeism, suspensions and graduation rates.
Since its rollout in 2017, the dashboard aims to show the progress of students at the state, district and school level using a color-coded system. It breaks this information down by 13 student subgroups, such as English language learners, disabled students and race and ethnicity. Friday’s update provides a snapshot of the progress made between the 2021-22 and 2022-23 academic years, representing the aftermath of the pandemic’s peak.
Red signals the poorest performance, followed by orange, yellow and green, while blue signals the best performance. State officials say that anything below green indicates the need for attention and improvement. Amidst the pandemic, the state stopped releasing this information in 2020.
The dashboard relies on some data, such as test scores and chronic absences, that was released in October. Other data — such as graduation rates and how many students met the entrance requirements to California universities, one measure of career and college readiness — were released Friday.
For the first time, this year’s dashboard adds a color-coded score to measure how many English learners are making progress toward proficiency on the English Language Proficiency Assessments of California (ELPAC).
On chronic absenteeism and English learner progress, the state’s status was yellow, a midway point between blue and red. The state’s status was orange — the second-worst status — for its suspension rate, graduation rate and performance on standardized tests for mathematics and English language arts.
State officials said the results demonstrate California schools are making progress in the wake of the pandemic, which witnessed sharp declines in standardized test scores and a surge in chronic absenteeism.
“Recovery from the pandemic has been a long process all across the country,” said California State Board of Education President Linda Darling-Hammond, in a statement. “While we have a long way to go, these results show that California is making strides, especially in enabling students to get to school and graduate ready for college and careers.”
The rate of students graduating from high school who met the minimum course requirements to attend a CSU or UC reached an all-time high: 45.15%. That number has continued to steadily increase throughout the pandemic, up from 41.24% in 2016-17.
The statewide four-year graduation rate is 86.2%, a decline from last year’s all-time high of 87%. State officials attribute 2021-22’s peak to a loosening of state graduation requirements and grading policies at the height of the pandemic. Officials say this most recent dip is due to a return to pre-pandemic policies.
The dashboard’s color coding system takes into account both whether a metric is high or low, and also whether that metric has declined, maintained or improved within the past year.
For instance, the orange ratings for math and English language arts test scores reflect the fact that after huge dips from pre-pandemic scores, there was little change from the previous year’s scores. Math scores edged up 2.6 points and English scores dipped 1.4 points.
The state’s chronic absentee rate in 2022-23 was 24.3%. That means nearly a quarter of students missed 10 or more days of school that year. That is a 5.7 point dip from the previous year’s all-time high of 30%. However, it is still a historically poor rate, roughly double the 2018-19 rate of 12.1%. Chronic absentee rates were above 20%, the worst category, in 62% of districts.
Data shows that chronic absenteeism surged nationwide in the wake of the pandemic, and it hit nearly every school district. Experts have said that sick days from Covid and quarantining can account for part but not all of the rapidly increasing absentee rates. The CDE trumpeted the state’s declining chronic absenteeism rate.
“This is encouraging news, and our work is not complete,” said Superintendent Tony Thurmond, in a statement. “We have made an unprecedented investment in services that address the needs of the whole child. We can see that those efforts are paying off, but this is only the beginning.”
But some questioned whether the dashboard’s metrics provide a meaningful portrait of progress in the state.
The dashboard was created before the pandemic when there were a different set of assumptions about what progress would look like in schools, said Heather Hough, executive director of PACE, a Stanford-based education research organization. Metrics didn’t tend to surge or nosedive year to year before the pandemic. Improvement on metrics like chronic absenteeism or standardized test scores are worth noting, she said, but the dashboard’s focus on one year of change can be misleading.
“That can mask the concern that we should still be having: A lot of students are far behind where they have been, and large portions of students are not attending school,” Hough said.
The color coding system has implications for which schools are eligible for additional assistance. Skyrocketing chronic absenteeism rates were largely responsible for a surge in schools that were eligible for differentiated assistance. In 2019, 333 school districts were eligible but by 2022 that number shot up to 617. This year 466 school districts were eligible.
Advocates for English learners also worry that the way that the dashboard presents metrics is downplaying an urgent issue in education.
The dashboard shows that about half (48.7%) of English learners in the state advanced at least one level or remained at the top level of English language proficiency, based on their scores on the ELPAC, a test English learners are required to take every year until they reach proficiency. This is about the same number who progressed as last year.
CDE considers this to be a yellow score — a medium number of students making progress toward English proficiency, and not much change in how many did so. In order to reach green, the number of students making progress toward English proficiency would have to increase by 2 percentage points.
Martha Hernandez, executive director of Californians Together, an organization that advocates for English learners statewide, said fewer than 50% of English learners making progress each year should be considered very low, or red, rather than medium, or yellow.
“That seems to be a passing score, so to speak, and really doesn’t create the sense of urgency to really focus on the needs of English learners,” Hernandez said. “We really think the state has low expectations for districts having students make progress.”
Hernandez said if students advance one level each year, they would achieve proficiency in six years, which is a reasonable expectation based on research. When students take longer than six years to achieve proficiency, they are considered long-term English learners and can struggle in middle and high school.
Californians Together has advocated for the state to change indicators for English learner progress. The group believes that districts or schools should receive a high, or green, level of progress if at least 70% of English learners progress at least one level in one year. Currently, the state considers 55% of English learners progressing at least one level to be high.
About a third of English learners (32.7%) in the state remained at one of the same lower levels of English proficiency as the year before on the test. Almost one fifth (18.6%) decreased one level in English proficiency.
Districts achieved varied scores on English learner progress – 66 were red, 215 orange, 152 yellow, 192 green, and 43 blue.
In addition, Californians Together criticized the fact that the dashboard rates English learners’ scores on English language arts and math tests together with the scores of students who have achieved proficiency in English in the last four years.
“It’s a very, very weak picture of the needs of English learners,” said Shelly Spiegel-Coleman, strategic advisor for Californians Together.
Melissa Valenzuela-Stookey, director of P-16 research at Ed Trust-West, said that the nonprofit that advocates for justice in education, is planning to dig into the data to get insight into what is happening for the state’s most marginalized students, but the initial data is concerning.
“This data shows that the status quo for students of color is unacceptable, and we’re making alarmingly slow progress — but it also points to schools and districts that are proving that we can do better,” Valenzuela-Stookey said.

The overreliance on undersupported part-time faculty in the nation’s community colleges dates back to the 1970s during the era of neoliberal reform — the defunding of public education and the beginning of the corporatization of higher education in the United States. Decades of research show that the systemic overreliance on part-time faculty correlates closely with declining rates of student success. Furthermore, when faculty are… read more

Panelists discussed dual admission as a solution for easing the longstanding challenges in California’s transfer system.

A grassroots campaign recalled two members of the Orange Unified School District in an election that cost more than half a million dollars.

Legislation that would remove one of the last tests teachers are required to take to earn a credential in California passed the Senate Education Committee.


Comments (4)
Comments Policy
We welcome your comments. All comments are moderated for civility, relevance and other considerations. Click here for EdSource's Comments Policy.
Scott Figgins 4 months ago4 months ago
The headline and first paragraph are not true. The California School Dashboard was released last year. While this year is the first year that it’s back to the color performance levels that incorporate Status and Change, that distinction is not made clear. So, for people who are familiar with the Dashboard, the headline and first paragraph undermine the article’s credibility.
Paul Meyers 4 months ago4 months ago
Thank you for this informative article. Since 2019, CA schools have a gained a significant amount of new teachers, school counselors, administrators, and other educators who are unfamilar with the Dashboard and its metrics.
Evan Coughenour 4 months ago4 months ago
Dashboard is still not helpful. I use http://www.ed-data.org/ to understand CA school quality.
Who can convince CDE to stop spending time/money producing a dashboard that obfuscates reality? I’d prefer they share nothing rather than this nonsense.
Micah Sittig 4 months ago4 months ago
Lots of good links in this article, but no link to the Dashboard itself:
https://www.caschooldashboard.org/