


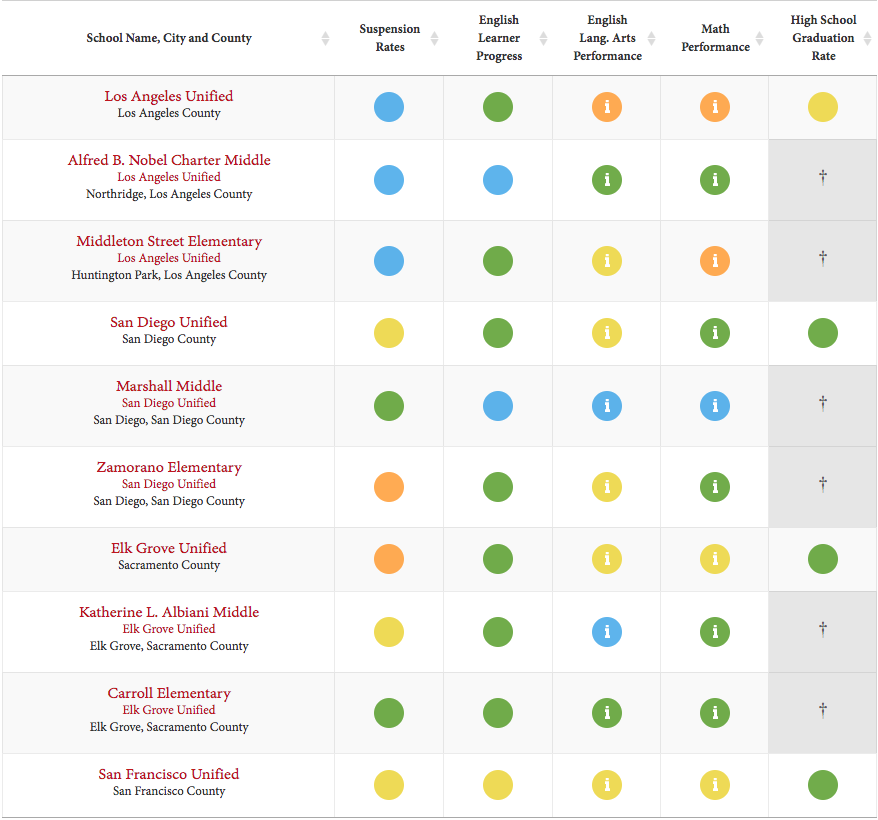
On Dec. 14, 2023, the California Department of Education updated the official California School Dashboard with the latest data for schools and districts. You can also view results for 2019, 2018, and 2017.* The dashboard shows achievement and progress, or lack of it, on multiple measures in color codes tied to performance metrics by the state. Enter a search term in the box to search by school, city, district or county. If a school or district does not appear, it means that no data is available. Detailed test scores are available on cells with an “i” (click to see more). For a full explanation, see the notes below the chart.
* The 2022 California School Dashboard only displays that year of results, without comparisons to the previous year, due to the disruptions caused by the pandemic.
| School Name, City and County | Chronic Absenteeism Rate | Suspension Rates | English Lang. Arts Performance | Math Performance | High School Graduation Rate | English Learners | Link |
|---|---|---|---|---|---|---|---|
| School Name, City and County | Chronic Absenteeism Rate | Suspension Rates | English Lang. Arts Performance | Math Performance | High School Graduation Rate | English Learners | Link |

Notes to Database
Color Codes and Ratings: The dashboard includes five color-coded performance levels, based on a combination of current performance level and change over the previous year. The color spectrum ranges from red to orange to yellow to green to blue, with red signifying the lowest performance level and blue the highest.
More information about how the performance levels were calculated is available at the California Department of Education’s website here.
Column Headings:
Chronic Absenteeism: Proportion of students who miss 10 percent or more of the school year — 18 or more days (high school grades excluded).
Suspension Rates: Based on a combination of current suspension rates and changes in those rates over time.
English Language Arts Performance: Student performance in Grades 3-8 and 11 on the English Language Arts Smarter Balanced tests administered in the current year, combined with whether scores improved, declined or stayed the same compared to the previous year.
Math Performance: Student performance in Grades 3-8 and 11 on the math Smarter Balanced tests in the current year combined with whether scores improved, declined or stayed the same compared to the previous year.
High School Graduation Rate: Combined four-year and five-year graduation rates, including current graduation rate along with whether rates have changed over the previous year.
For more information about how the performance levels were calculated, go to the California Department of Education’s website here.
For the full dashboard for each school or district, go here.
Read more:
)
)