
Black teachers: How to recruit them and make them stay

Lessons in higher education: What California can learn

Keeping California public university options open

Superintendents: Well-paid and walking away

The debt to degree connection

College in prison: How earning a degree can lead to a new life
In 2017, California education leaders heralded the significant increase in the state’s 8th-grade reading scores on the National Assessment of Educational Progress as a sign that the state’s investment in education and its adoption of the Common Core standards had taken hold.
Curb that enthusiasm. In 2019, California’s 8th-graders gave back the gain, as did much of the nation, underscoring that progress on state and national standardized tests is best measured over a decade, not in single years.
The latest scores of NAEP, the closely watched national assessment taken by a sample of 4th- and 8th-graders in every state, showed that California largely followed the national pattern this year with little to no change in math but a significant decline in 8th-grade reading on a scale of 500 points.
In math, both California’s and the nation’s 8th-grade scores fell less than 1 point. The nation’s 4th-grade math score rose 1 point and California’s rose 3 points — though it was not considered statistically significant because of the sample size.
The biggest change was in reading and the news was not good. Joining 30 states whose 8th-grade reading scores also fell, California’s decline of 3 points, the same as the nation, about matched its point gain in 2017.
In 4th-grade reading, the national score fell 2 points, which was considered significant, while California’s 1 point rise was not. Only one state, low-scoring Mississippi, saw a gain in 4th-grade reading.
Los Angeles Unified, one of three California districts whose results are reported, had big single-year drops of 6 points in both 8th-grade math and reading. It was the largest decline of the 27 urban districts participating in the Trial Urban District Assessment project.
Taking a longer view, the national results show from 2009 to 2019 there was no improvement in math scores. Stagnant results in reading go back at least two decades for national results in both 4th and 8th grades.
In math, since 2013 national scores of the highest-performing students have risen, while scores of students who have struggled — those who score in the lowest 10th and quarter of test takers — have continued to drop.
“It is not clear why it is happening, but it is consistent,” said Peggy Carr, associate director of the federal National Center for Education Statistics, which administers NAEP.
Carr declined to speculate on the reasons there has been “frustratingly no progress in the past decade” on NAEP. Opponents of the Common Core will cite the adoption of the standards in most states in 2010 or a letup in accountability for standardized testing with the relaxation of the federal No Child Left Behind law’s penalties, then the replacement of the law with the Every Student Succeeds Act in 2015.
Michael Petrilli, president the Ohio-based Fordham Institute, suggested a different reason: the decline in spending on education “for the first time in American history,” following the Great Recession.
“I think we are still seeing the effect of that, even as states are starting to open their wallets again,” he said. The recession had a particularly negative impact on low-income families, whose children are now in the grades being tested, he said.
California policy leaders who have stressed patience while districts adapt to the Common Core and praised increases in K-12 funding, starting in 2013, will not disagree. While the nation as a whole was treading water, California did slowly narrow the gap, in some areas significantly, between it and the national average over the past decade. Steady progress overall in reading can be tracked back to 2003.
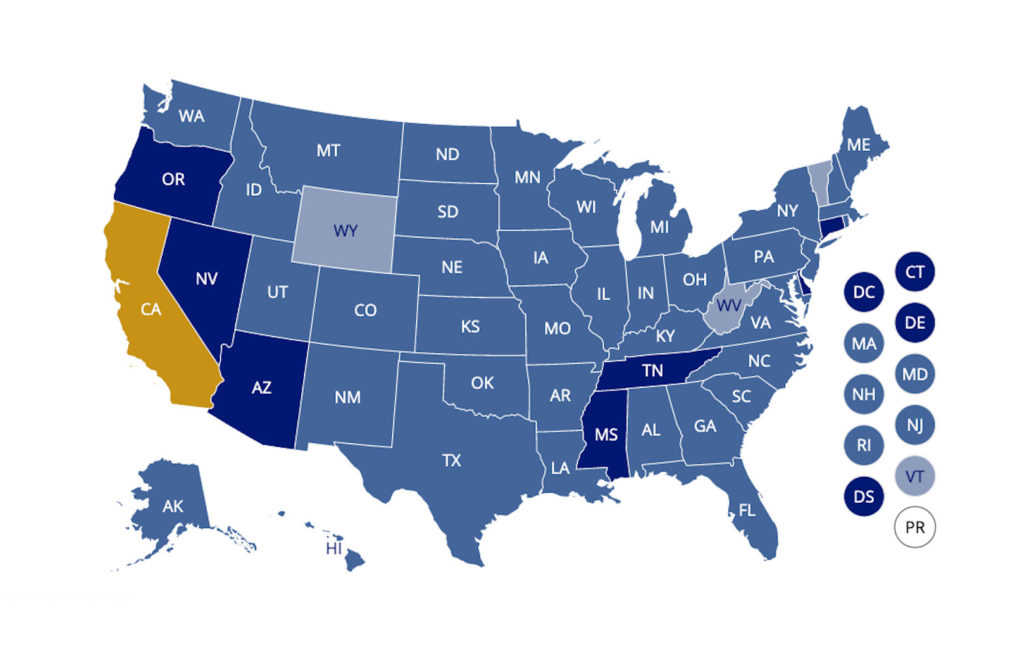
California was statistically behind 43 states in 4th-grade reading in 2009. It was statistically behind 22 states in 2019. It was statistically behind 43 states in 2009 in 8th-grade reading and behind 28 states this year.
In 4th-grade math, California was statistically behind 43 states in 2009 and behind 37 states in 2019. In 8th-grade math, it was statistically behind 45 states in 2009 and behind 35 states this year.
And while the gap between high- and low-performing students has expanded nationally in both subjects, it occurred only in 8th-grade reading in California, with the percentages of students scoring below basic — the lowest category — and scoring advanced both grew substantially in 2019.
California has among the nation’s highest proportions of low-income students and English learners. To account for demographic differences among states, the nonprofit Urban Institute has adjusted scores to compare similar students. Using that approach raises California’s 2019 score and state ranking significantly in both math and reading in both grades – elevating its 4th grade reading scores, for example, from the bottom quarter to the top quarter of states. You can find this interactive tool and technical appendix, which the Urban Institute released on Wednesday, here.
As with the state’s annual standardized assessment, the Smarter Balanced test, there remain huge disparities in performance on NAEP among racial and demographic groups and progress in closing the gaps has been mixed.
The large gap between students qualifying for the federal lunch program and those who don’t shrank and 3 points in 8th-grade reading between 2009 and 2019. It narrowed 9 points in 8th-grade math — one of the biggest declines nationally — but still remained, tied with Ohio, the largest in the nation: 36 points. The gap between whites and Latino students also declined a little in both subjects and grades.
But the gap between black and white students increased 10 points, to 37, in 4th-grade math and 12 points, to 38, in 8th-grade math, one of the largest in the nation, during that time. Black students’ reading scores actually declined in both grades.
About 294,000 students took the reading test and 297,000 students took the math test in schools across the nation in 2019. While randomly selected, the students were representative of states’ demographics.
NAEP is designed to test what a board of experts has determined students are supposed to know in 4th and 8th grades. Questions are not based on any state curriculum, although studies have shown that the questions are consistent with expectations of the Common Core standards that most states, like California, have adopted partly or fully.
Los Angeles Unified, Fresno Unified and San Diego Unified are among the California districts that participated in the Trial Urban Districts Assessments project, encompassing more than half of students in cities with populations larger than 250,000.
While Los Angeles Unified’s scores took a hit this year, San Diego was the only district whose scores significantly exceeded the 27-district average in both subjects and grades. Since 2003, scores in 4th-grade math have risen every year except one.
Fresno Unified, one of the lowest-income cities in California, has narrowed the gap in math scores between it and the other urban districts in 4th grade but not 8th grade, where it was 21 points below the urban average in math this year.
Over the past decade, L.A. Unified’s NAEP scores have shown progress in reading, particularly in 4th grade. Before the big drop this year, 8th grade math had increased since 2009 but been flat in 4th grade. In both grades and both subjects, its scores in 2019 are below the urban districts’ average.
“Los Angeles Unified has made gains over time in both reading and math, thanks to the dedication and hard work of our educators, students and families,” Interim Chief Academic Officer Alison Yoshimoto-Towery wrote in a statement. “Our charge is to ensure a sense of urgency to close opportunity gaps for students and accelerate our rate of progress,”

Panelists discussed dual admission as a solution for easing the longstanding challenges in California’s transfer system.

A grassroots campaign recalled two members of the Orange Unified School District in an election that cost more than half a million dollars.

Legislation that would remove one of the last tests teachers are required to take to earn a credential in California passed the Senate Education Committee.

Part-time instructors, many who work for decades off the tenure track and at a lower pay rate, have been called “apprentices to nowhere.”


Comments (8)
Comments Policy
We welcome your comments. All comments are moderated for civility, relevance and other considerations. Click here for EdSource's Comments Policy.
Jay Thorwaldson 4 years ago4 years ago
Excellent overview. But I didn’t see a list of school districts participating in the survey/assessment. And there was no reference to the impact of reportedly pervasive use of “social media,” and cell phone, techno-gaming and other forms of distractions from books and homework. Jay
Bruce William Smith 4 years ago4 years ago
The rate of progress in Los Angeles Unified is negative, and, as elsewhere in the United States, the bigger problem is in mathematics rather than reading, even if the Common Core degrades the latter. A solution that deserves support is that which Secretary DeVos has been promoting, educational freedom, so that those of us who have long known, from firsthand experience, that the policies the Obama administration was promoting were not working, and who want … Read More
The rate of progress in Los Angeles Unified is negative, and, as elsewhere in the United States, the bigger problem is in mathematics rather than reading, even if the Common Core degrades the latter. A solution that deserves support is that which Secretary DeVos has been promoting, educational freedom, so that those of us who have long known, from firsthand experience, that the policies the Obama administration was promoting were not working, and who want to accelerate the Common Core, for those who can keep up, to match the pace set by the world’s leading districts such as Shanghai and Singapore, can do so, without being blocked by the incompetents with the LAUSD bureaucracy who have been leading that city towards the disaster it now suffers.
Replies
Dr. Bill Conrad 4 years ago4 years ago
We have significant problems in reading and mathematics achievement not to mention science! The Common Core Standards have become a straw dog for more fundamental problems facing K-12 education. If the system were able to successfully implement the Common Core Standards with high quality and aligned professional practices, we would see enormous gains in student achievement. The Common Core Standards are not the problem. The problem is lack of quality curriculum and the systematic and aligned … Read More
We have significant problems in reading and mathematics achievement not to mention science!
The Common Core Standards have become a straw dog for more fundamental problems facing K-12 education. If the system were able to successfully implement the Common Core Standards with high quality and aligned professional practices, we would see enormous gains in student achievement. The Common Core Standards are not the problem. The problem is lack of quality curriculum and the systematic and aligned application of quality professional practices.
The problem is that the state released the Common Core Standards on a totally unprepared K-12 system that does not have a good track record of implementing anything. A well planned curriculum a long with the Common Core Standards would have been extremely benefical but this would be way beyond the capabilities of the moribund CDE bureaucracy!
We also have the problem that the K-12 system is not sufficiently professional yet to implement high quality and aligned professional practices. We need way more structure for K-12 and a lot less freedom. It is time to end the “Let the teachers teach” trope and begin to demand massive improvements in professional practices at the teacher, principal, and district adminstrator levels. Of course all of this should begin with a transformation of the Colleges of Education to recruit the finest students and train them well. We are no where close to that dream yet!
So advocating for educational freedom is exactly the wrong thing that we need to do. We need to promote a more scientific, systematic, and accountable approach to K-12 education that will clear the fog that currently permeates the system.
We need to seriously get into the red zone of teaching and learning at the classroom level before there will ever be any improvement in reading, math, and science performance by our students.
It’s time to end Obama bashing as that is so 2000 and late!
Dr. Bill Conrad 4 years ago4 years ago
PS: Of course Betsy promotes “educational freedom” as it is easier to hawk her snake oil within a balkanized education system rather than one that is systematic, scientific, coherent, and accountable!
Dr.Bill Conrad 4 years ago4 years ago
I think it would be helpful if everyone would take a moment to read the article called the Fork Debate by Laura Thomas. Laura makes the argument that when we face very serious problems in our lives, we tend to focus our discussions on more trivial problems rather than deal with harder root cause issues. While the computer-based methodology of the NAEP may contribute somewhat to the drop in reading scores, it is trivial compared to … Read More
I think it would be helpful if everyone would take a moment to read the article called the Fork Debate by Laura Thomas. Laura makes the argument that when we face very serious problems in our lives, we tend to focus our discussions on more trivial problems rather than deal with harder root cause issues.
While the computer-based methodology of the NAEP may contribute somewhat to the drop in reading scores, it is trivial compared to more fundamental root cause problems in reading achievement.
The K-12 system has systematically rejected the findings and recommendations of the the National Reading Panel recommendations in favor of a failed theory of action that posits that reading skills can be achieved through a gradual exposure to increasing Lexile levels of reading materials. Noam Chomsky argued that the ability to acquire oral language is hard-wired in the brain and can be achieved through minimal exposure. Reading cannot be learned in this fashion. It requires explicit instruction and monitoring in the fundamental areas of phonemic awareness, phonics, fluency, comprehension, and vocabulary.
The fact that educators are given license to follow non-scientific approaches to teaching reading is a key root cause issue that needs to be addressed sooner rather than later.
Schools of education that require only a 3-hour course reading pedagogy for their students is another huge root cause problem in the failure of our students to be able to read! And these courses tend to reinforce the failed theory of action that exposure to increasingly higher increasing complexity of reading materials will lead to literacy!
K-12 education is an alchemistic and raconteur system. Until this system becomes more scientific and demands adherence to quality curriculum and pedagogy, we will continue to reap what we sow!
Elizabeth 4 years ago4 years ago
A lack of computer skills due to the high cost of technology and the large number of second language learners would make a significant difference in test scores. These tests do not measure the growth we teachers see in the classroom every day.
Eric Wenrick 4 years ago4 years ago
When did the NAEP tests shift from paper-based to relying only on computers and was the impact of that shift examined when reporting NAEP results?
Replies
John Fensterwald 4 years ago4 years ago
Great question, Eric. In response, I received this reply from Grady Wilburn, a statistician with the National Center for Education Statistics: "When we transitioned from paper-based assessment (PBA) to a digitally based assessment (DBA), we did study the impact. There is more information on that transition here with a short video explaining the transition here. The result was placing the NAEP DBA onto the NAEP PBA scale, with the necessary adjustments. "I should note that the 2019 … Read More
Great question, Eric.
In response, I received this reply from Grady Wilburn, a statistician with the National Center for Education Statistics: “When we transitioned from paper-based assessment (PBA) to a digitally based assessment (DBA), we did study the impact. There is more information on that transition here with a short video explaining the transition here. The result was placing the NAEP DBA onto the NAEP PBA scale, with the necessary adjustments.
“I should note that the 2019 results look at common items from the 2017 DBA to the 2019 DBA to determine whether the nation/state/or District had score changes.”