
Black teachers: How to recruit them and make them stay

Lessons in higher education: What California can learn

Keeping California public university options open

Superintendents: Well-paid and walking away

The debt to degree connection

College in prison: How earning a degree can lead to a new life
 Results of the last California standards tests that most students will ever take were also the most disappointing.
The percentage of students scoring proficient or better on the 2013 Standardized Testing and Reporting assessment fell for the first time in more than a decade in results released Thursday.
The decline in STAR test results was slight, an average of less than one percentage point for all tests in all grades, but is noteworthy because there have been gains every year since 2003.
Most of the California standards tests are being phased out starting this year due to the switch to Common Core State Standards. The new assessments for Common Core will begin in 2014-15 and are being developed by the Smarter Balanced Assessment Consortium, in which California has a lead role. Only those standardized tests required under the federal No Child Left Behind law will be given to California students this coming year.
State Superintendent of Public Instruction Tom Torlakson downplayed the downward turn, saying the scores show “remarkable resilience” following some $20 billion in cuts and 30,000 teacher layoffs in recent years, a drain that is just now turning around due to voter approval of Proposition 30 in November. The initiative will raise millions for schools through temporary increases in sales and income taxes.
“While we all want to see California’s process continue, these results show that in the midst of change and uncertainty, teachers and schools kept their focus on student learning,” Torlakson said in a statement.
“Overall, students held their ground,” concurred Dean Vogel, president of the California Teachers Association. “Some schools have lost entire support systems in that counselors are gone and libraries have closed. We have some of the largest class sizes in the nation and rank near the bottom in per-pupil funding.”
Scores still remain higher than in 2002, the first year STAR tests were fully aligned to state standards. At that time, 35 percent of students scored proficient or above in math, science and English language arts and 29 percent were proficient or better in history and social science.
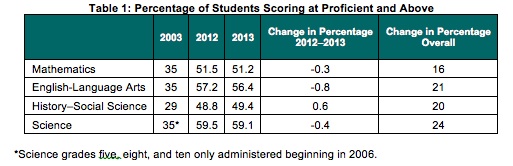
Source: California Department of Education
About 4.7 million California students took the 2013 exams and 51 percent of them scored proficient or better in math, while 56 percent scored proficient or above in English language arts, 59 percent in science, and 49 percent history and social science.
Even though the percentage of students scoring in the highest levels continued to rise until this year, those increases became smaller in recent years. In 2009, the average gain was 4.25 points. It has fallen every year since then, dropping to an average gain of 2 points in 2012.
Retired test publisher Doug McRae has been analyzing the STAR results annually and has developed a grading system based on the GPA or Grade Point Average scale. He gave this year’s results an F.
“It’s the sort of stuff that when you looked at it four or five years ago, it was pretty minor,” he said, referring to the slowdown in the percentage of students achieving proficiency in recent years. “But over time it’s become significant.”
One subject that McRae singles out for a closer look is algebra. A state-initiated plan to place more eighth grade students in Algebra I classes has been very successful, based on the number of students taking the Algebra I STAR test. That number jumped from about 16 percent in 1997 to more than two-thirds this year. Even with more students taking the class, proficiency rates for eighth graders increased by 15.5 percentage points during that time.
11th grade math question from Smarter Balanced practice test.
Education consultant John Mockler, former executive director of the State Board of Education and chief architect of Proposition 98, the school finance plan, called the participation gains in Algebra I “the most impressive part of California’s testing system.”
However, Algebra I will be eliminated from the eighth grade curriculum under Common Core, as EdSource Today reported, and the Algebra I standards test will no longer be given. Mockler said it’s very possible that fewer students will take and do well in algebra as a result, but without a state test to measure it, “we just don’t know.”
The STAR results also show that the achievement gap hasn’t abated for African American, Hispanic, low-income and English learner students. In math, for example, Asian students overall increased their proficiency rates by one percentage point, to 78 percent. White students remained the same, at 62 percent. Proficiency rates among low-income; Hispanic and African American students are 43, 42 and 35 percent respectively. Unchanged from last year are rates for low-income and African American students. Proficiency rates are down by 1 percentage point for Hispanic students.
Torlakson cited the transition to Common Core as a second reason that scores fell this year, but analysts doubt that had any impact.
“I’m a little skeptical that Common Core is a big factor, for a couple of reasons,” said Paul Warren, a research associate at the Public Policy Institute of California and a former analyst with the state Legislative Analyst’s Office. “First, (the state Department of Education) found that California’s standards are very similar to Common Core’s. Second, science standards fell and Common Core doesn’t cover science.” The same goes for high school math.
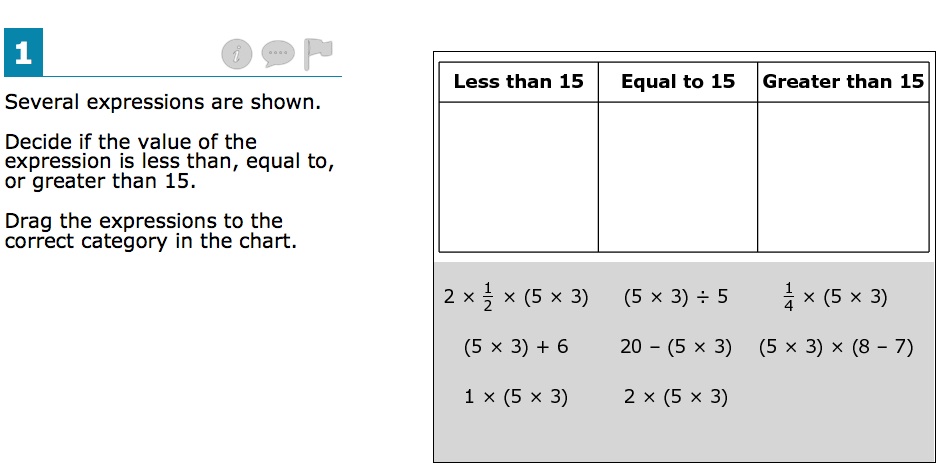
5th grade math question from Smarter Balanced practice test.
There is concern over how well students will do on the first few rounds of Common Core tests, especially after New York state’s dismal performance earlier this week. Even though state officials there warned the public that the first time wouldn’t be pretty, folks were generally outraged when fewer than a third of students in grades three through eight met or exceeded proficiency standards in English language arts and math.
In the spring of 2014, Smarter Balanced will conduct a field test of its assessment involving about 20 percent of participant schools in all member states. California hasn’t yet determined how the field test schools will be selected. The assessment is computer adaptive, which uses a program that adjusts the difficulty of questions based on whether a student correctly answers the previous question. There will also be a traditional pencil-and-paper version available.
Next spring is also when California’s STAR testing program officially ends. Many exams are already riding into the sunset and will no longer be given. Those include:
As of now, the only Common Core standards ready to go are in math and English language arts; history is in the works. Separate science standards are being developed based on the Next Generation Science Standards.
At a Sacramento news conference Thursday morning, Torlakson was asked if he’ll miss the STAR testing program. “It had its value,” he answered, “but I’m not sad to see it go.”

Panelists discussed dual admission as a solution for easing the longstanding challenges in California’s transfer system.

A grassroots campaign recalled two members of the Orange Unified School District in an election that cost more than half a million dollars.

Legislation that would remove one of the last tests teachers are required to take to earn a credential in California passed the Senate Education Committee.

Part-time instructors, many who work for decades off the tenure track and at a lower pay rate, have been called “apprentices to nowhere.”


Comments (65)
Comments Policy
We welcome your comments. All comments are moderated for civility, relevance and other considerations. Click here for EdSource's Comments Policy.
Gary Ravani 11 years ago11 years ago
The discussions of the "how" of assessment seem less relevant than the "why." According to the nation's highest scientific body, the National Research Council, the test driven "accountability" systems implemented over the course of the last decade have not contributed to student learning and have contributed to the demeaning of the curriculum. Since neither CCSS nor SBAC have been widely field tested as yet we shall have to see if they constitute any kind of … Read More
The discussions of the “how” of assessment seem less relevant than the “why.” According to the nation’s highest scientific body, the National Research Council, the test driven “accountability” systems implemented over the course of the last decade have not contributed to student learning and have contributed to the demeaning of the curriculum. Since neither CCSS nor SBAC have been widely field tested as yet we shall have to see if they constitute any kind of improvement. According to the advertising they will. According to the advertising.
Replies
Manuel 11 years ago11 years ago
In retrospect, Gary, I agree. The entire business of assessment is driven by the belief that we, the taxpayers, must demand accountability of public schools because we are paying for the schools. That all the testing has not contributed to greater learning is irrelevant. What matters is that accountability needs to be maintained. How else are we to know that our public employees are doing what they are getting paid for? Advertisement, you say? No, sir, it … Read More
In retrospect, Gary, I agree. The entire business of assessment is driven by the belief that we, the taxpayers, must demand accountability of public schools because we are paying for the schools.
That all the testing has not contributed to greater learning is irrelevant. What matters is that accountability needs to be maintained. How else are we to know that our public employees are doing what they are getting paid for?
Advertisement, you say? No, sir, it is not advertisement. It is a solemn promise to carry out the wishes of the public: they demand accountability. To quote a prominent member of one of the panels that gave us the CST: “Once standards are approved, a curtain falls and the general public is not privy to the sausage-making of assessment, trusting professionals to execute faithfully what the public has blessed.” We need to trust, Gary. If we can’t trust them, who can we trust?
Matt Brauer 11 years ago11 years ago
As there are no error bars on any of the estimates, it is impossible to ascertain the significance of the change in scores, and all of the discussion of "why...?" and "how...?" is completely meaningless. Doesn't anyone involved in interpreting standardized tests have a basic (i.e., high-school level) understanding of statistics? Maybe we should be testing the testers, to see if they understand anything at all about estimation. Read More
As there are no error bars on any of the estimates, it is impossible to ascertain the significance of the change in scores, and all of the discussion of “why…?” and “how…?” is completely meaningless.
Doesn’t anyone involved in interpreting standardized tests have a basic (i.e., high-school level) understanding of statistics? Maybe we should be testing the testers, to see if they understand anything at all about estimation.
Replies
Doug McRae 11 years ago11 years ago
OK, Matt, I'll byte and claim at least high school level understanding of statistics . . . though my Ph.D. minor in statistics was 45-50 years ago so that training may not be up to HS level statistics today. Grin. Test developers pay a whole lot of attention to error bars or confidence bands when they construct tests, since suitable standard errors of measurement (what these animals are called in the educational measurement domain) are part … Read More
OK, Matt, I’ll byte and claim at least high school level understanding of statistics . . . though my Ph.D. minor in statistics was 45-50 years ago so that training may not be up to HS level statistics today. Grin.
Test developers pay a whole lot of attention to error bars or confidence bands when they construct tests, since suitable standard errors of measurement (what these animals are called in the educational measurement domain) are part and parcel of any large scale test development project and one of the factors that generates credibility for its scores. And providing error bands for individual student results is standard operating practice for almost all large scale testing programs — I think error bands are provided on current STAR individual student reports that go out to all students/parents and teachers. But confidence bands for aggregate test results are not as prominently used for interpretations of aggregate results — the reason is that confidence bands for groups of scores assume that the scores were obtained from a random sample of the population of interest. And, as we all are aware, students are not assigned to groups (schools, districts, whatever) on a random basis — students go to schools more based on housing patterns than anything else, and in any case the notion of random assignment is simply not present. So, confidence bands on aggregate scores from large scale tests have limited utility. And then there is the fact that error bands for any aggregate data depend a great deal on the size of the group contributing to the aggregate data. So, we have to take group size into account whenever we attempt to use error bands for aggregate data, and that is a complicating factor for the interpretation of group test data. The bottom line is that most undergraduate textbooks on testing say that pure statistical interpretation of group test scores is problematic, that it is better to use a concept of “educational meaningful” rather than statistically significant when interpreting group test scores. At least that is what Anastasi, Cronbach, and Mehrens/Lehmann said when I first took courses in testing about 50 years ago [those were the main undergrad textbooks on the market in the ’60s]. So, from a “tester” perspective, that’s why we advise deviation from straight statistical interpretation of group test results. Doug
Manuel 11 years ago11 years ago
Mr. Brauer, since there is no error in the data collection, there are no error bars in the raw data. Given that the algorithms introduce no error other than rounding-off errors, I'd say there no error bars on that either. What there is, however, is variability in responses as well as in the cohorts. Keeping the cohort the same and giving the test over and over to the same kids will not give you the same … Read More
Mr. Brauer, since there is no error in the data collection, there are no error bars in the raw data. Given that the algorithms introduce no error other than rounding-off errors, I’d say there no error bars on that either.
What there is, however, is variability in responses as well as in the cohorts. Keeping the cohort the same and giving the test over and over to the same kids will not give you the same results every time. I have no idea if anyone can define an “error bar” for that type of result. I am sure that those that can will have taken statistics at a level much higher than high school, possibly upper-division or maybe even graduate school.
Then comes the variability due to the cohorts. For the variability to be kept to a minimum, you would have to have similarly taught cohorts from year to year. That’s an impossibility so let’s not even try to continue along this line.
We are so used to believing that if some action is taken repeatedly we will get the same results. Not so. We will get results that are approximately the same but will vary within a range. That range is affected by the conditions of the action and the fact that every theoretical description of an action has been very simplified in order to put it in mathematical terms that can be solved analytically thereby telling us what the variables are and what can be measured. Even then, tracking the error source is not simple.
Anyway, true, we need the people that are interpreting standardized tests to know what they are talking about. Else we are being mathematically intimidated by the misuse of data.
navigio 11 years ago11 years ago
'Mathematically intimidated', I like that. Yes, I was surprised not only that there was no mention of individual grade or subgroup results, but also neither of demographics. The proficiency rates of individual grades did not reflect that of the state. Specifically, high school grades were up or flat in ELA (about 5 percentage points for 9th grade!), for example. Grade makeup also changed slightly (though I don't know that it was enough to 'explain' anything). Interestingly, … Read More
‘Mathematically intimidated’, I like that.
Yes, I was surprised not only that there was no mention of individual grade or subgroup results, but also neither of demographics. The proficiency rates of individual grades did not reflect that of the state. Specifically, high school grades were up or flat in ELA (about 5 percentage points for 9th grade!), for example. Grade makeup also changed slightly (though I don’t know that it was enough to ‘explain’ anything). Interestingly, ethnic makeup seems pretty much identical with the exception that students seemed to be classified differently, ie many students appear to be classified as 2 or more races who were in individual ethnic subgroups or didnt report a race at all last year. This pattern is reflected at state and county levels but is probably not significant enough to introduce any change in subgroup rates for that reason alone. Our own district, on the other hand…
Fun stuff this data intimidation… 😉
Cal 11 years ago11 years ago
"Her math CST results — and she confirms that she did apply herself — placed her just barely above Basic. The previous year she was also in the Proficient bucket." That's not necessarily surprising. Calculus AP teachers prep their kids ferociously by rote. I know a lot of kids who got 5 on their BC Calc test who barely got 650s on their SATs and basic on their CSTs. I'm assuming that last year she took precalc … Read More
“Her math CST results — and she confirms that she did apply herself — placed her just barely above Basic. The previous year she was also in the Proficient bucket.”
That’s not necessarily surprising. Calculus AP teachers prep their kids ferociously by rote. I know a lot of kids who got 5 on their BC Calc test who barely got 650s on their SATs and basic on their CSTs.
I’m assuming that last year she took precalc and this year Calc, which means that both years, she took the same test–the Summative test. That would test her underlying knowledge of Algebra, Geometry, and Algebra 2. As I just pointed out, it’s not at all unusual for a students to be thoroughly prepped in Calc but relatively weak in algebra and geometry. Recall also that the students taking Summative are going to be the best in the state, so the standards might be higher.
So the most likely takeaway from your story is not “CSTs are unreliable” but “my daughter is good at studying for tests, but probably needs to devote more energy to remembering what she’s learned.”
As a rule, the CSTs are pretty good tests. Not great, but good. I find all the talk about this “meaningful” score drop to be unconvincing in the extreme, but the CC tests, assuming we get them, assuming we invest billions paying for them, are going to be even worse. Depressing, really.
Replies
Karen 11 years ago11 years ago
Cal, she took an accelerated integrated math program that spirals algebra, geometry trig, preCalc, etc continuously through a 2-year program. Her AP Calc teachers lean toward real-world applications during class time, then do intensive test prep in a 2-day camp the week prior to the AP tests. I would presume that if your theory were correct, her ACT & SAT test scores would show similar weaknesses, but did not. Her recently completed placement tests for college … Read More
Cal, she took an accelerated integrated math program that spirals algebra, geometry trig, preCalc, etc continuously through a 2-year program. Her AP Calc teachers lean toward real-world applications during class time, then do intensive test prep in a 2-day camp the week prior to the AP tests.
I would presume that if your theory were correct, her ACT & SAT test scores would show similar weaknesses, but did not. Her recently completed placement tests for college math also reflect solid skills in all areas tested.
So, yes there was some Calculus test prep, but the school-level focus is to reinforce all content along the way. This is why we have concerns.
I’ve never heard anywhere other than your post here that the CSTs are a better indicator of math capability than the SATs, grades, AP scores, etc. Guess we’ll find out more in her college courses next month!
Karen 11 years ago11 years ago
Cal, the college placement results are in. She tested out of all levels of math required for her Pre med/ physical chemistry major. She’ll still take math, but I will stand by my concern that there’s something amiss in the CST testing and results.
At parent orientation, other parents from California had similar experiences. The only comfort is that our testing stories were far surpassed by those shared by parents from NY public schools.
Karen 11 years ago11 years ago
Fascinating discussion. On the anecdotal front, we have seen some wonky results on our kids' scores the past couple of years. Because they have no bearing on our kids individually, we didn't do anything other than shrug and wonder what else might be wrong with the CST/STAR testing data. One example: my high school daughter is an advanced math student, scoring a '5' on her AP Calculus exam. Her math CST results -- and she confirms … Read More
Fascinating discussion. On the anecdotal front, we have seen some wonky results on our kids’ scores the past couple of years. Because they have no bearing on our kids individually, we didn’t do anything other than shrug and wonder what else might be wrong with the CST/STAR testing data.
One example: my high school daughter is an advanced math student, scoring a ‘5’ on her AP Calculus exam. Her math CST results — and she confirms that she did apply herself — placed her just barely above Basic. The previous year she was also in the Proficient bucket. Every year prior her results were in the 97%-99% range. She swears she finished every question, understood them all and has no clue howher STAR test results could change so drastically and conflict so extremely with her AP, ACT and SAT scores. From the gist of conversations with other high school and middle school parents, we are by no means alone.
As a parent, it gives me pause to see policy and weighty discussions built on something that to us appears to be deeply flawed.
Replies
Manuel 11 years ago11 years ago
Karen, when I first started looking at the CSTs I was surprised I could not get information that made sense to me as a numbers wonk. Then I got involved in a series of workshops at LAUSD that were meant to examine the connection between classroom marks and CST scores. This task force had its genesis on a minor brouhaha: a valedictorian could not pass the CAHSEE. Her/his parents complained to Superintendent Cortines who demanded an … Read More
Karen, when I first started looking at the CSTs I was surprised I could not get information that made sense to me as a numbers wonk.
Then I got involved in a series of workshops at LAUSD that were meant to examine the connection between classroom marks and CST scores. This task force had its genesis on a minor brouhaha: a valedictorian could not pass the CAHSEE. Her/his parents complained to Superintendent Cortines who demanded an investigation into it. The then Chief Educational Officer, Judy Elliott, Ph.D., ask for the data to be examined.
A staffer created bar graphs for both ELA and math CSTs for grades 5, 8, 9, 10, and 11 from all the students in the District. The bars represented the % of students in each achievement band (advanced, proficient, etc) and there was one bar per classroom mark (1-4 for 5th graders, A-F otherwise). Her analysis of the secondary students led her to the astonishing conclusion that there was grade inflation and deflation simultaneously. How else to explain the nearly 50% of A students who were not proficient and above in all grades and in both math and ELA? How else to explain that there were advanced students getting Fs?
Unfortunately, she did not notice that the distribution of scores for 5th graders was nearly identical in ELA and math. And the same could be said for secondary students who were getting As. Those distributions matched the cutting points defined in 2000 and 2001 that Doug refers to above.
My conclusion: the CSTs are a statistical exercise having nothing to do with how well the student is doing in the classroom. (Your daughter is Exhibit A!)
(If more people like you would be willing to publicly speak out on the disconnect between CST scores and classroom/AP test scores, we might get somewhere. But almost everybody I tell the above story just shakes their head, walks away, and refuses to talk about it anymore. Meanwhile we will be replacing the CSTs by another crop of test that we have no idea what score distributions they will produce nor who is going to decide what the cutoff points will be. And if you want the graphs I mentioned, give me your email and I’ll send them to you.)
el 11 years ago11 years ago
I am still confused about the conclusion relating to a valedictorian who could not pass the CAHSEE. In our small rural school with a wide ability range, usually most of the kids pass on the first try. Was the conclusion that the student did not know the content? Or was the conclusion that the valedictorian was artificially selected? (That happened when I was a student; the most objectively worthy kids diluted their grades by having … Read More
I am still confused about the conclusion relating to a valedictorian who could not pass the CAHSEE. In our small rural school with a wide ability range, usually most of the kids pass on the first try. Was the conclusion that the student did not know the content? Or was the conclusion that the valedictorian was artificially selected? (That happened when I was a student; the most objectively worthy kids diluted their grades by having the audacity to take classes like Band which was only worth 4 instead of 5.)
Manuel 11 years ago11 years ago
The way Dr. Elliott told the tale the kid was deserving of being valedictorian and the parents were simply dumbfounded that their precious offspring could not pass a test that is supposed to be 9th grade English and 8th grade math. The complaint, apparently, was that the school did not prepare the kid to pass the CAHSEE. Because of this, the kid could not be up on stage because passing the CAHSEE is one of the … Read More
The way Dr. Elliott told the tale the kid was deserving of being valedictorian and the parents were simply dumbfounded that their precious offspring could not pass a test that is supposed to be 9th grade English and 8th grade math.
The complaint, apparently, was that the school did not prepare the kid to pass the CAHSEE. Because of this, the kid could not be up on stage because passing the CAHSEE is one of the requirements to participate in graduation ceremonies. This must have been devastating, etc., etc., so something must be wrong with the school and not with the kid.
Of course, this was never reported anywhere. What was stated in the memo sent to mark the creation of a task force officially named “Marking Practices and Procedures Task Force Personnel” was this:
“Academic grades are supposed to reflect a student’s level of success in mastering grade-level standards in all subject areas at each grade level. An LAUSD analysis of California Standards Test (CST) and grades assigned in grades 8, 9, and 10 English and mathematics courses revealed cases where grades did not correlate with the student’s CST results.”
Not surprisingly, nothing came out of this task force as it got entangled with the homework snafu that lead to Elliott leaving. LAUSD politics, you know.
BTW, I did not think of asking Dr. Elliott what happened to the kid. Was s/he allowed to walk the stage or not? My guess is that s/he was allowed by order of the Superintendent.
navigio 11 years ago11 years ago
Actually, it wasnt 1 percentage point, it was 8 tenths in ELA and 3 tenths in math, though I expect with so many scores, these are still statistically significant. The thing that is curious is that it seems the test themselves could easily play that much of a role (even though you mentioned you didnt think they did). It is interesting to try to think of a policy that was so consistent that it applied … Read More
Actually, it wasnt 1 percentage point, it was 8 tenths in ELA and 3 tenths in math, though I expect with so many scores, these are still statistically significant. The thing that is curious is that it seems the test themselves could easily play that much of a role (even though you mentioned you didnt think they did). It is interesting to try to think of a policy that was so consistent that it applied to 5 million kids in a similar manner (or a smaller group thereof to a greater extent).
It would be nice to see the numbers for different district sizes at which the changes become statistically significant. I can’t tell you how many times i’ve heard a district say ‘on par with the state-level changes’ and use that to describe an equal percentage point change, but of course if sample size changes the significant ‘cutoff’, those two numbers might not be ‘on par’ at all. In fact, the same number might be significant in one case and meaningless in another. I would expect the numbers to be different for proficiency rates than for the individual performance ‘bins’. But of course, those impact API in a potentially significant way and may even magnify the insignificance of proficiency rates. Why does the state not provide such guidance? Can you do so? thx.
Replies
Doug McRae 11 years ago11 years ago
Actually, Navigio, the one percent change I was referring to above is not the difference between zero and the decrease, but rather the difference between the previous year's gain (which was +2.0 points) and the current year's gain (which was -0.65 points) or a difference of 2.65 percentage points. That difference is not only statistically significant, but also educationally meaningful. The aggregate gain statistic I calculate for my initial observations on STAR results is kinda … Read More
Actually, Navigio, the one percent change I was referring to above is not the difference between zero and the decrease, but rather the difference between the previous year’s gain (which was +2.0 points) and the current year’s gain (which was -0.65 points) or a difference of 2.65 percentage points. That difference is not only statistically significant, but also educationally meaningful.
The aggregate gain statistic I calculate for my initial observations on STAR results is kinda a poor man’s API, an unweighted average of only the E/LA gains for 10 grade levels and the Math gains for 6 grade levels. It can be done in a few minutes after release of STAR results, rather than waiting for a month or so for the more complex weighted API data to be released. The rationale behind my “A” thru “F” grading system for these gain scores is much the same as the rationale behind the API goal of gains equal to 5 percent of the distance between the previous API and the statewide goal of 800, but for my poor man’s API that number comes out roughly to roughly 2.0 percentage points for raw unweighted gain scores — thus I assign a “C” grade to gains of 2.0 percentage points involving the close to 5 million students contributing to those gains. My statement that one percent is both statistically significant and educationally meaningful for this statistic is support for assigning a GPA-like meaning to the one percent differences between each grade level in the “A” thru “F” system.
It would be pretty straightforward for a psychometrician or statistician to provide the numbers for different district sizes (or school sizes) at which the changes become statistically significant. But, as noted above, statistical significance is not a good criteria for interpreting these differences. Whether a gain score is educationally meaningful or not is a much more nuanced decision and not so amenable to straight statistical calculations. But, as you note above, most of the interpretations of STAR results are not solely based on statistical considerations, but rather are “spin” designed to carry a message a policymaker wants to communicate. K-12 tests operate in this kind of public policy environment, so I don’t criticize policymakers for providing these kinds of interpretations, but when needed I’m willing to point out when the “spin” is inconsistent with the reality of the numbers.
Doug McRae 11 years ago11 years ago
Navigio: Your comment asked "What do we have to base the assumption that a gain is supposed to occur?" Then it went on to talk about actual results being a feedback loop to the cut score process and resetting cut scores and new test questions chosen based on previous year answers, etc. Perhaps the best way to approach your questions is to talk about how "standards-based tests" were conceptualized about 20 years ago -- the term … Read More
Navigio: Your comment asked “What do we have to base the assumption that a gain is supposed to occur?” Then it went on to talk about actual results being a feedback loop to the cut score process and resetting cut scores and new test questions chosen based on previous year answers, etc.
Perhaps the best way to approach your questions is to talk about how “standards-based tests” were conceptualized about 20 years ago — the term “standards” was chosen to represent expectations or goals for what folks wanted to the taught, and standards-based tests were designed to measure desired curriculum and instruction. This concept was in sharp contrast to the prevailing notions behind both national norm-referenced tests designed to measure relative achievement on what was currently being taught (not necessarily what folks wanted to be taught) and criterion-referenced tests which were designed to be more fine grained measurement for achievement on specific content objectives (not more broadly based “content standards”) again on what currently was being taught rather than what folks wanted to be taught. Thus, standards-based tests were conceptualized as a new paradigm for K-12 tests, designed to measure expectations that were higher than current established curriculum and instruction practices. The notion included fixed cut scores (or, using more technical language “performance standards”) which would serve as the basis for measuring achievement progress over time toward the expectations or goals set out by approved “content standards.” So, to directly answer your question, the notion that gains were supposed to occur over time was built into the conceptualization of standards-based tests and standards based curriculum and instruction programs, which were promulgated by the feds in the late ’90’s via IASA and then mandated via NCLB in 2002. The current state-by-state standards-based tests, then, are the result of this conceptual progression with expected increases set by the feds AYP program and in California by our accountability API program.
On the operational aspects for our STAR California Standards-Based Tests, the so-called actual results feedback loop for setting cut scores occured only once in the life of the STAR tests, and that was back in 2000 and 2001 when the cut scores for STAR CSTs were originally set. During those standards-setting, the process included looking at actual item-by-item raw score results as part of the standards-setting process. Once cut scores were set back in 2000 and 2001, the cut scores have not been reset or changed. New items have been added to the tests to replace retired items over time on a programed schedule, primarily for test security purposes. The new questions have not been chosen based on previous year results; rather, they have been chosen to maintain the integrity of the CST blueprints which include not only content specifications but also psychometric specifications for items. When new items are installed, the overall test form that results may be a little bit easier or a little bit harder than the test form it replaced, and to insure that the “cut scores” are equivalent from year-to-year, equivalency or equating adjustments to the cut scores have been made from year-to-year.
I hope this explains both where the expected gains notion originated for standards-based tests, as well as some of the mysteries around how fixed cut scores are set and maintained for our CSTs so that the CSTs can indeed measure actual gains (for comparisons against expected gains) over time.
Manuel 11 years ago11 years ago
Thank you, Doug, for this very complete narrative on the CSTs. It does, however, confirm what I've been clumsily ranting about: ETS created a norm-referenced test where the "norm" was the entire state while basing all questions on the state's standards. Presto-chango, we got a "standards-based test" that is reproducible year after year. No wonder the histograms are so robust: they barely change and we argue endlessly over the merits of a point or two (or three!) … Read More
Thank you, Doug, for this very complete narrative on the CSTs.
It does, however, confirm what I’ve been clumsily ranting about: ETS created a norm-referenced test where the “norm” was the entire state while basing all questions on the state’s standards. Presto-chango, we got a “standards-based test” that is reproducible year after year.
No wonder the histograms are so robust: they barely change and we argue endlessly over the merits of a point or two (or three!) change on the average of the distribution.
Meanwhile the media keeps saying that “nearly half of California students are not on grade level.”
Good grief…
Doug McRae 11 years ago11 years ago
Sorry, Manuel: The facts are that ETS did not create a norm-referenced test and call it a standards-based test. The facts are that Harcourt Educational Measurement (the STAR vendor in the early 2000's) created a standards-based testing system with fixed cut scores that have been maintained by ETS since 2003 and employed to allow CA to measure achievement change over time. The underlying histograms you cite only reflect an undisputed point since academic achievement … Read More
Sorry, Manuel: The facts are that ETS did not create a norm-referenced test and call it a standards-based test. The facts are that Harcourt Educational Measurement (the STAR vendor in the early 2000’s) created a standards-based testing system with fixed cut scores that have been maintained by ETS since 2003 and employed to allow CA to measure achievement change over time. The underlying histograms you cite only reflect an undisputed point since academic achievement tests have been in existance, that achievement is normally distributed regardless of how the test is designed, whether it is norm-referenced relative measurement with changing normative cut points over time or criterion-referenced with fine grained cut scores only for fine grained instructional objectives, or standards-based with fixed cut scores designed to measure gains or growth over years. Accurate media reports say that only about 1/3 of CA students were proficient when the CSTs were introduced in 2003, but that a little more than half are now proficent. If we project that growth out over another 10 years, accurate media would say that more than 3/4 of CA students are proficient. [I’m not suggesting we continue with STAR for another 10 years . . . we do need to change the statewide tests to reflect the Common Core standards that have been adopted, and over time we need to move to computerized tests just to get into the 21st Century.] My point is there is nothing in the standards-based system that requires results to remain at roughly 50 percent proficient; the system is not designed that way.
Manuel 11 years ago11 years ago
Indeed, that is the arcana of testing: the responses will eventually approach a normal distribution after multiple administrations. Thank you for bringing that to the front of the discussion. But that happens only if the behavior of the test takers does not change over time. Instead, there has been a relentless drive to pump up the scores which has gone into a frenzy over the last few years. Under those conditions, if the tests questions were solely focused … Read More
Indeed, that is the arcana of testing: the responses will eventually approach a normal distribution after multiple administrations. Thank you for bringing that to the front of the discussion.
But that happens only if the behavior of the test takers does not change over time.
Instead, there has been a relentless drive to pump up the scores which has gone into a frenzy over the last few years.
Under those conditions, if the tests questions were solely focused on the standards, by now the entire distribution would have moved at least 60 points to the right because teachers would have been teaching to the test. They haven’t as the change has been roughly 30. And California teachers can’t be that bad, can they?
Conversely, if the “evolution” of the test is organic and, indeed, the mean of the histograms is moving up very slowly (about 2 to 3 points per year for the mean), then the CSTs are an impediment to academic growth because they maintain the proficient population artificially low. That, on the average, that population is poor should give anyone pause.
Thus, it doesn’t matter if I am correct or you are correct. Allowing this type of test (whether it is the CST or the Common Core) to be the source of many high-stakes decision is morally wrong. Why do continue to allow it?
navigio 11 years ago11 years ago
Thanks Doug. I hope you don't mind me continuing to respond. This is a discussion I've been wishing would be had for years now. I understand that setting a fixed performance standard that was different than (above) existing ones would tend to provide a path for improvement toward that standard, but I'm not clear what changes from year to year that would cause that to happen forever. Perhaps you are simply saying that a norm-referenced methodology … Read More
Thanks Doug. I hope you don’t mind me continuing to respond. This is a discussion I’ve been wishing would be had for years now.
I understand that setting a fixed performance standard that was different than (above) existing ones would tend to provide a path for improvement toward that standard, but I’m not clear what changes from year to year that would cause that to happen forever. Perhaps you are simply saying that a norm-referenced methodology tends to lack ‘incentive’ to improve (actually, by definition, it lacks an improvement indicator, but I wont go there for now). In contrast a fixed standard methodology can always act as a baseline, and that alone provides the incentive to do something different in order to increase the number of kids over that cutoff. If that’s what you’re saying, I have to admit thats pretty interesting, and I guess would explain the fact that it aligns with the idea of accountability being useful simply because someone is paying attention.
However, my question about improvement was not necessarily about incentive, but about teaching. In 2013, a 2nd grader will have been alive for about 7 years, and will have lived their entire life within the span of this fixed standard system. Even in 2010, the same could be said for a 2nd grader. And if one takes only school years (K-2, since thats where the vast majority of the test-based mechanism has its impact), the same could be said for 2nd graders from 2005 forward. Thats 8 years of 2nd grade results. However, looking at those results, they have been more or less on a constant increase since that time. Is the assumption that early on, maybe schools didnt really care much about increasing proficiency rates (perhaps because the NCLB 100% proficiency bomb was still a long way off?). Or perhaps the reason is that its taken us 10 years to figure out how to teach to those standards? (In theory, the blip we are seeing this year might be the leveling off point? Or perhaps we are not done and this is the result of something else). From a pedagogical standpoint, assuming everyone cared, I cant really see a reason why the scores would increase forever (or even for more than a test-takers lifespan, after which all test takers will have lived under the same influences).
The interesting thing about all this is that it aligns with the apparent arbitrariness of NCLB thresholds, ie it doesnt really matter what the thresholds are, as long as they exist and are enforced (assuming the ‘incentive’ mentioned in the first paragraph is valid). Personally, I cant see how the Fed’s limits were a result of any kind of realistic expectation, or involved study or logic. Rather, they seemed to draw a point at the current proficiency rates, and then a line from that point to 100% and that was to be the cutoff for acceptable increases each year (is there any research that shows what the expected increase should be if the impact is simply one of having a fixed threshold? And did it match those arbitrary yearly increases? I would expect the pressure to increase as the cutoff date is neared, though that seems not to have happened either). The only way those cutoffs might have been the result of something thoughtful was in that they let the states define what proficiency meant, but even then, the standards would have had to be ‘aligned’ with those arbitrary increases in order to make any sense. Something tells me they werent (nor I expect would we actually want them to be). I guess in common core, one idea is to do away with differing state-set proficiency standards. And ironically, some of the early common core assessment results are pretty close to where we were back in 2003 or maybe a bit earlier. And although I probably shouldn’t have to ask this if I’d paid enough attention, I assume the common core assessments will ‘remain’, fixed-standard? Will there be a ‘resetting’ as in 2000-01 with CSTs?
I hope I understood correctly, and that I am making even a little sense.. and I very much appreciate your patience.. 🙂
el 11 years ago11 years ago
I also am skeptical of the notion that scores can or should go up every year, and would remind us all of the peril of comparing negative changes with positive changes sometimes creating artifacts. I would also point out that giving an F for a -1 that puts you at the second highest score to date kind of ties your hands compared to a result of -10 or more that was more comparable with the first … Read More
I also am skeptical of the notion that scores can or should go up every year, and would remind us all of the peril of comparing negative changes with positive changes sometimes creating artifacts.
I would also point out that giving an F for a -1 that puts you at the second highest score to date kind of ties your hands compared to a result of -10 or more that was more comparable with the first years they were given. 😉
I’ve talked to several administrators who have mentioned anecdotally the stress the recession has caused, not just in terms of lack of school staff and resources, but parents that are stressed and tense, more relocations, and how that has reflected back to school discipline and culture. You can make up any story you want for why these numbers are what they are, but any given year there are a multitude of possibilities for positive and negative influences not just inside individual schools but across the state at large.
navigio 11 years ago11 years ago
Ok, maybe I am asking too many questions? :-) Doug, my mind was going a 100mph when I wrote that and I wrote it on a cell phone, so I admit its a bit chaotic. I will try to distill my 'point' in this comment. Hopefully it is clearer. You said, "So, to directly answer your question, the notion that gains were supposed to occur over time was built into the conceptualization of standards-based tests and … Read More
Ok, maybe I am asking too many questions? 🙂
Doug, my mind was going a 100mph when I wrote that and I wrote it on a cell phone, so I admit its a bit chaotic. I will try to distill my ‘point’ in this comment. Hopefully it is clearer.
You said, “So, to directly answer your question, the notion that gains were supposed to occur over time was built into the conceptualization of standards-based tests and standards based curriculum and instruction programs…”
Saying this is ‘built into’ the tests would imply that we make the tests easier each year in order to increase proficiency (obviously not what is happening if its a criterion-referenced test and if these tests correlate exactly from year to year). How could it be ‘built-in’?
Saying that is ‘built into’ the standards based curriculum and instruction programs is odd because that would also imply that either those standards and/or programs are still evolving (ie we’ve only been introducing them slowly–why in the world would we be doing that??!) or that there are outside influences that carry over from previous portions of a student’s life that the new standards and programs are still trying to ‘overcome’. This would have been a valid point a few years ago, but the reason I keep mentioning how long a test-taker has been alive is that if the curriculum, the instruction programs, the tests and the proficiency references have all intentionally remained static for the past however many years, then there is no way we could ever expect increases in student test scores as a result of that system itself. At least not for 2nd graders since 2010, and probably not for any kids since about 2005. So something must be changing.
Simply saying its ‘built in’ is not really what I was looking for. 🙂
(I still concede that you may have meant the simple fact that we have a fixed cutoff gives people incentive to improve, whereas a relative one does not. However, I still dont know if that’s what you meant to imply. If it is, then it also means the changes in test scores over the past decade are mostly a result of people not caring before, and caring more now. That seems like a problematic conclusion. Regardless, it would be good to see the research upon which that ‘theory’ of improvement is based.)
Doug McRae 11 years ago11 years ago
Nagigio: The inference or interpretation for increasing test scores is certainly not based on tests being easier from year-to-year [CA and its vendor spend a lot of time and money insuring the tests are equivalent from year-to-year]nor even that the curriculum and instruction programs are still evolving [though that might be the case particularly early in the tenure of a standards-based testing program]. Rather, the inference or interpretation is that student achievement increases because … Read More
Nagigio: The inference or interpretation for increasing test scores is certainly not based on tests being easier from year-to-year [CA and its vendor spend a lot of time and money insuring the tests are equivalent from year-to-year]nor even that the curriculum and instruction programs are still evolving [though that might be the case particularly early in the tenure of a standards-based testing program]. Rather, the inference or interpretation is that student achievement increases because instruction gets better over time — i.e, these tests are built to measure the results of instruction, and the expectation is that collective instruction for adopted content standards will improve with time. That is the inference or conclusion that the test designer is attempting to address with this type of test . . . . [Parenthetically, but not to open another can of worms, it’s quite another issue to attempt to attribute increases in achievment to the results of an individual teacher’s instructional efforts, and many if not most test makers voice concerns with the validity of these large scale tests when they are applied to inividual teacher evaluations, not because of the test properties per say but rather because of the validity of the attribution to individual teachers . . . . I wrote a commentary on this contentious issue some time ago for EdSource Today’s predecessor blog some time ago.]
navigio 11 years ago11 years ago
Hi Doug. Thanks for the response. I have not been ignoring you, but doing some reading and thinking. You have really given me a lot to think about. :-) I think I mentioned elsewhere that I noticed an odd kind of change this year in the CSTs (YoY), specifically, the changes were different across grades. At first I was looking at my district and simply attributed this to mostly randomness (grade size is not that big), but … Read More
Hi Doug.
Thanks for the response. I have not been ignoring you, but doing some reading and thinking. You have really given me a lot to think about. 🙂
I think I mentioned elsewhere that I noticed an odd kind of change this year in the CSTs (YoY), specifically, the changes were different across grades. At first I was looking at my district and simply attributed this to mostly randomness (grade size is not that big), but it got me thinking so I also looked at the state results by grade. Since entire state results are considered statistically significant at even less than one percent change, I figured statewide grade results could probably be considered such as well (there are almost a half million test takers per grade).
The odd thing I noticed–and this seemed to be reflected to some extent at my district level–though not entirely–was the fact that there were drops in some grades and increases in others. Not just small numbers like less than 1%, but on the order of 5% in some grades.
Specifically, in ELA there was about a 2.25 point drop in elementary grades, a 1 point drop in middle school grades and a 2.3 point increase in high school grades. But it gets even more interesting: The drop is pretty consistent for 2nd, 3rd, 4th, 5th, 7th and 8th (2 to 3 point), but there were increases in 6th grade, 9th grade and 10th grade. And surprisingly enough, 9th grade had a 5 point increase in ELA scores! That seems humongous at the state level.
In thinking about the suggestion that CC might have something to do with that, I guess it might make sense that any CC changes might impact elementary more (those kids are also still more malleable). And I guess in theory, one might even decide to implement CC starting with the first class of each secondary school level (ie 6th and 9th). However, that would not explain why those grades increased, while elementary grades decreased. I was also struck by a recent UTLA poll of its teachers who did not seem to indicate much training for CC (that could mean either they are flying blind, or it could mean they are still working the old way).
One thing I always do with test results is try to sanity check the demographics, since that can often explain more than anything. The general trend for all the major ethnic subgroups was pretty much identical (just with varying degree).
Perhaps even odder, this trend was reflected in our mid size district (just under 20,000), ie large increases in 6th grade and 9th grade but even larger decreases in most of the other grades from 8th on down (an exception was we had an increase in 3rd and small decreases in 10th and 11th). Although I know we can discount our results due to the smaller sample size, the fact that they pretty much mirror state level results (except for degree) makes me think they are experiencing similar influences.
Math is a bit of a different story. At the state level there was a relatively large (3 point) drop in 3rd grade and smaller ones for Geometry and Algebra II (2 and 1), while the rest of the middle and lower grades either held steady or increased slightly (including Algebra I). This basic pattern was reflected in the ethnic subgroup results. Similarly, there was a 2 point increase in Algebra I proficiency, with a 2 point decrease in Geometry and 1 point in Algebra II. I dont know if those results could be considered statistically significant, but if they are, they are noteworthy for their gap (4 point switch for 3rd grade compared to 2nd or 4th).
The other odd switches were in science (also reflected in ethnic subgroups), where there was a 3 point drop in 5th grade science, but small increases in 8th and 10. Similarly, 3 point drops in biology and chemistry, but holding flat in physics. Those EOC science (and math) results are a bit trickier to analyze because not everyone takes them and participation can be influenced by other factors.
Anyway, the point of all this mumbo jumbo was to highlight that when looked at with a finer granularity, there seems to be something very specific going on at the grade level, and more importantly, different things at different grade levels (it seems odd to imagine that different teachers have consistently gotten much better or worse at the curriculum in just one year–eg enough to explain an 8 percentage point switch between state level 5th and 9th grade ELA results. Perhaps there are some other policy related behaviors affecting these things, but then we would be measuring something else.
Any thoughts on this? Do you think half a million students is a small enough sample size to explain these as more random occurrences than anything else? Does a mirroring at ethnic subgroup and partially district level give the results any additional statistical significance?
On a related note, I noticed this past year ETS released the frequency distribution for the raw scores. I went back a few years and did not see these things released before. Do you know why they would not do that before? Is that giving away too much of the ‘special sauce’? 🙂 I asked ETS if they had any of this data and whether any of their other currently provided data can be provided in any form other than PDF. They said no.
el 11 years ago11 years ago
Navigio, here is an idea to go with your very interesting observations. 5th graders and below have had their whole school career under tightening budgets and loss of CSR, loss of librarians, etc. Might be interesting to see if that trend holds up in higher resourced districts that had parcel taxes and other support beyond what was typical, and/or if districts that kept 180 days/CSR did better. High schoolers might be seeing that those early years of CSR … Read More
Navigio, here is an idea to go with your very interesting observations.
5th graders and below have had their whole school career under tightening budgets and loss of CSR, loss of librarians, etc.
Might be interesting to see if that trend holds up in higher resourced districts that had parcel taxes and other support beyond what was typical, and/or if districts that kept 180 days/CSR did better.
High schoolers might be seeing that those early years of CSR paid off.
Or it might be that the test difficulty changed.
navigio 11 years ago11 years ago
Hi El. Yeah, I'll try to see if I can find any big enough to matter. ;-) Actually, now that I think about it, in that EdSource survey, some of those large districts were pretty low-poverty. I'll see if I can find some time.. The odd thing is when looking at last year's state-level YoY results, essentially everything increased (and not insignificantly) except for 2nd grade math. I mean, literally across the board (state level, … Read More
Hi El. Yeah, I’ll try to see if I can find any big enough to matter. 😉 Actually, now that I think about it, in that EdSource survey, some of those large districts were pretty low-poverty. I’ll see if I can find some time..
The odd thing is when looking at last year’s state-level YoY results, essentially everything increased (and not insignificantly) except for 2nd grade math. I mean, literally across the board (state level, by grade). Those kids have been under those same pressures. That said, I have to admit with props 30 and 38 and the impending threat to slash education spending had 30 failed, we may have finally started to see the impacts (as mentioned before, our district kicked the can down the road, and even this year is having to cut millions) so maybe you’re right, but it’s just been delayed.
Doug McRae 11 years ago11 years ago
Navigio: Responding to your lengthy reply posted at 3:34 pm yesterday (there was no reply button there): Actually, there is a big difference between the percent proficient data based on aggregating 10 grades of E/LA scores and 6 grades of Math scores [almost 8 million scores] and the statewide grade level by content area scores [involving about half million scores each]. My indication that one percentage point difference from year-to-year was meaningful … Read More
Navigio: Responding to your lengthy reply posted at 3:34 pm yesterday (there was no reply button there): Actually, there is a big difference between the percent proficient data based on aggregating 10 grades of E/LA scores and 6 grades of Math scores [almost 8 million scores] and the statewide grade level by content area scores [involving about half million scores each]. My indication that one percentage point difference from year-to-year was meaningful was based on the aggregate of the almost 8 million scores. I would not say a one percentage point difference was meaningful for individual grade level content area scores differences from year-to-year — I’d venture you need a 3 to 5 point difference for statewide scores involving about a half million scores before the difference can be said to be meaningful. When you get down to district level scores, I recollect your district has about 20,000 students, or roughly 1600 students per grade level. Interpretation of grade level content area differences from year-to-year for your local district should use perhaps a 10 percentage point difference as the guideline for a meaningful difference.
While I can provide some expert opinion on HOW to interpret meaningful differences for test results from year-to-year, when you get to the WHY part of interpreting scores, well, everybody is entitled to their own opinions. The Why question deals with information and perceptions for what’s going on in schools, from statewide to districts to individual schools, and that information and perception varies widely among K-12 school observers. It is the variation in those individual sets of information and perceptions that creates both interest and controversy when it comes to interpreting results of large scale testing programs. The EdSource Today venue provides a valuable outlet for individual opinions on the Why part of test results. As a test maker, I don’t claim any special expertise for answering the Why question, but I’m willing to weigh in with my opinions when I have them, just like everyone else in this space contributing their opinions on the 2013 STAR test results released by the SPI this year.
navigio 11 years ago11 years ago
Thanks for your response Doug. I know my description was a bit chaotic. To be clear, there was a 5 point change in 9th grade ELA and 3 point changes in some other grades. For me the odd thing is that those were in the opposite direction from other grades, making the effective difference even much larger (ie what might have been a 1 of two point difference is an 8 point difference this year. … Read More
Thanks for your response Doug. I know my description was a bit chaotic. To be clear, there was a 5 point change in 9th grade ELA and 3 point changes in some other grades. For me the odd thing is that those were in the opposite direction from other grades, making the effective difference even much larger (ie what might have been a 1 of two point difference is an 8 point difference this year. I know you keep saying the tests are dead on and not subject to variation but I cannot see how a specific policy behavior could have such an impact at just certain grade levels, at least not for a group as large as the entire state. I do want to make comparisons to other years to see whether there were similar variations before (I already did 2012 vs 2011 and nothing like this could be seen).
Anyway, I’d love to hear your take on why. Not the entire state results, but the differences for 9th grade from other grades, for example. Thanks again.
Doug McRae 11 years ago11 years ago
Navigio: OK, I've taken a look at the SPI Press Release tables (#2 for Math, # 8 for E/LA) again. Let's count how many differences greater than 3 points for the 16 grade level / content areas for which comparisons are apples-to-apples. For 2013, there is only one such difference, the grade 9 E/LA you mentioed. For 2012, I see two such differences, for grades 6 and 7 Math. For 2011, I … Read More
Navigio: OK, I’ve taken a look at the SPI Press Release tables (#2 for Math, # 8 for E/LA) again. Let’s count how many differences greater than 3 points for the 16 grade level / content areas for which comparisons are apples-to-apples. For 2013, there is only one such difference, the grade 9 E/LA you mentioed. For 2012, I see two such differences, for grades 6 and 7 Math. For 2011, I see no such differences. My interpretation would be this pattern of differences from year-to-year for grade by content scores does not exceed what might be normal variations in scores, in other words not enough to search hard for reasons why these “meaningful” differences occured. If you know of specific circumstances for any of the individual grade levels / content areas, those circumstances might explain those specific results, but the pattern is not enough to say “Gee, these are large differences, let’s go search for reasons why . . . ” On the other hand, when you go back to 2005, you find that all 6 Math grades had greater than 3 point differences, and 6 of the 10 E/LA grades had greater than 3 point differences, with all of these differences in the + direction. That was a banner year for good STAR results. Those kind of differences were not normal variations in scores — they were unquestionably meaningful increases in achievement across the entire state. Searching for reasons why for 2005 was not only a reasonable but also a pleasant exercise, given that the results were uniformly positive.
navigio 11 years ago11 years ago
Ok, I took a quick look at a couple large low poverty districts: clovis, saddleback, poway, capistrano. Each one had increases in 9th grade ELA. None had an increase in any ELA grade below 9th (in other words, grades 2 through 8 were either flat or decreased in every grade. In fact, 2 of the 4 had decreases in every single grade below 9th, while another had decreases in every grade below 9th, except for … Read More
Ok, I took a quick look at a couple large low poverty districts: clovis, saddleback, poway, capistrano. Each one had increases in 9th grade ELA. None had an increase in any ELA grade below 9th (in other words, grades 2 through 8 were either flat or decreased in every grade. In fact, 2 of the 4 had decreases in every single grade below 9th, while another had decreases in every grade below 9th, except for one (and that grade was flat). Even though these are large districts, they are probably no longer statistically significant at each grade, so these exact same patterns must just be randomness. I guess I understand that CA level results are made up of individual district results, so seeing a similar pattern is expected, but this incessant decline everywhere but 9th is really starting to bother me.. much as my comments are starting to bother everyone else.. 😉 Did we put something in the water 15 years ago..?
Doug McRae 11 years ago11 years ago
Navigio: Well, I'm not sure something in the water 15 years ago will hold water as an explanation for increasing test scores . . . .(grin). But if there was something statewide or even in certain kinds of districts / schools different for 9th graders last year than for other grade levels, then that would be a decent explanation. I can't think of any statewide initiative, or the way statewide dollars to districts were handled, … Read More
Navigio: Well, I’m not sure something in the water 15 years ago will hold water as an explanation for increasing test scores . . . .(grin). But if there was something statewide or even in certain kinds of districts / schools different for 9th graders last year than for other grade levels, then that would be a decent explanation. I can’t think of any statewide initiative, or the way statewide dollars to districts were handled, that would fit that bill. The pattern of 9th grade vs other grades does raise some suspicion, but the non-sexy explanation that in any large kettle of fish (numbers) there will be a portion of those fish (numbers) that are not in concert with the other fish (numbers) in the kettle still might be the best explanation we have.
Manuel 11 years ago11 years ago
Doug, there is one possibility that could explain navigio's observations: someone at ETS did not follow "the program" and the tests for 2013 "allowed" this outcome. The tests are, after all, created by humans and errors do happen... Read More
Doug, there is one possibility that could explain navigio’s observations: someone at ETS did not follow “the program” and the tests for 2013 “allowed” this outcome.
The tests are, after all, created by humans and errors do happen…
Doug McRae 11 years ago11 years ago
Manuel: Yes, I agree, it's always possible there was a glitch somewhere in the the way the tables were loaded for scoring, or something like that. The CSTs forms used this last spring were repeats of previous forms used (no new items was my understanding) so the work ETS does to ensure comparability of forms when new or replacment items are added to forms would not seem to be a place where a glitch … Read More
Manuel: Yes, I agree, it’s always possible there was a glitch somewhere in the the way the tables were loaded for scoring, or something like that. The CSTs forms used this last spring were repeats of previous forms used (no new items was my understanding) so the work ETS does to ensure comparability of forms when new or replacment items are added to forms would not seem to be a place where a glitch would materialize. But, the pattern of variation uncovered by Navigio would not seem to result from errors in the scoring tables or errors in data aggregations. Also, it’s also a possibility test security was violated, that someone out there had a copy of the previous form that was re-used and discretely disseminated it widely enough to cause 9th grade scores to be higher. That doesn’t seem probable given the number of higher scores needed to generate a +5% difference over years, but it has to be on a list of possibilities. You are correct, it’s always a possibility that something more nefarious could have caused the pattern that Navagio surfaced.
el 11 years ago11 years ago
Is one percentage point even statistically significant? I want to repeat navigio's excellent point about the changes we make -good and ill - taking time to work through the system. We only had two classes go K-12 under class size reduction, for example. Cuts for the last three years have created much larger class sizes, especially for primary grades. Cuts to preschool will be reverberating through the system for the next 10 years. And each district had … Read More
Is one percentage point even statistically significant?
I want to repeat navigio’s excellent point about the changes we make -good and ill – taking time to work through the system. We only had two classes go K-12 under class size reduction, for example.
Cuts for the last three years have created much larger class sizes, especially for primary grades. Cuts to preschool will be reverberating through the system for the next 10 years. And each district had different kinds of cuts and different resource issues.
Replies
Doug McRae 11 years ago11 years ago
EL: The short answer is -- Yes, for the statewide aggregate test data in CA, one percent is statistically significant. But, statistical significance isn't the right criteria to use for interpreting these test results -- the better question is whether the results are educationally meaningful. The answer to that question is more judgment than science. Before I came back to CA in 1990, I spent 15 years in Michigan working with school and district level testing … Read More
EL: The short answer is — Yes, for the statewide aggregate test data in CA, one percent is statistically significant. But, statistical significance isn’t the right criteria to use for interpreting these test results — the better question is whether the results are educationally meaningful. The answer to that question is more judgment than science.
Before I came back to CA in 1990, I spent 15 years in Michigan working with school and district level testing data, and I was frequently asked “How big a change in scores is meaningful enrough to take action?” My stock answer was . . . . . 10 points — look for 10 point changes from year-to-year and even over multiple years before you can be confident test score changes are meaningful. That worked well for almost all schools and district level data in Michigan — I did modify my advice for Detroit PS which had about 150,000 students in those days, telling Detroit that changes greater than 5 points were meaningful. For statewide CA data, our sheer size puts us on a different planet — for statewide data aggregated across grades, we are talking 5 million student scores, and for trend data over 10+ years we are talking 50 million scores entering into the analyses. Much smaller changes have to be interpreted as educationally meaningful.
For test scores for very large groups of students like CA’s statewide data, my judgment process crystalized about 10 years ago when Bob Linn published an opinion, supported by reams of data, that 3 to 4 point gains per year were good solid gains for statewide test scores, hitting the upper range of what could be expected from statewide testing data over multiple years. That opinion very much confirmed my observations from more than 30 years of looking at statewide as well as local district and local school test results over time. My view was that annual gains of about 2 points were quite average, that 3 to 4 point annual gains were very good when maintained over periods of years, and that anything more than that was exemplary and very noteworthy. Since these seeminging small numbers were easily minimized by pundits as well as the public, I decided that using a GPA analogy would help communicate meaningful differences — a change from an “A” to a “C” communicates a meaningful change moreso than a change from 4 to 2 percentage points. So I began to use a translation from STAR raw percent gains to a GPA-like grading system some 5 to 10 years ago to best describe annual test results for CA. The CA STAR longitudinal data from this system is what is provided in my “Initial Observations” document that Kathy linked in her post above.
The STAR 2013 results showed a decrease of between 2 1/2 and 3 grade levels from the average gains recorded in 2010, 2011, and 2012. Dropping almost 3 grade levels (from a middlin’ “C” to a fairly deep “F” grade) is unquestionably educationally meaningful. That’s tough reality to accept, and there are reasonable explanations to mitigate this result, particularly the fiscal downturn of the past five years that thankfully appears to have come to an end. But, sweeping the data under the table by saying it isn’t meaningful is not a responsible way to treat the information.
This is a long answer to your simple question. But, it is important to distinguish between the variability of school and district level data that are familar to most educators, public, and media in any state, and the statewide results that come from aggregating data for millions of students rather than 10’s or 100’s of students. So, the short answer to your real question is . . . Yes, one point differences are educationally meaningful for CA statewide STAR scores.
el 11 years ago11 years ago
Thanks for taking the time to give me such a detailed answer, Doug.
Manuel 11 years ago11 years ago
Please forgive me for flogging what could be a dead horse. But it seems that you, Doug, have been doing this for a living more than anyone else in here. Me? Never done psychometrics but have learned what little I know of statistics "on the job." This idea that a one percent change in the average of the "number of proficient students" is significant has me totally puzzled. I've been turning the problem around and around but … Read More
Please forgive me for flogging what could be a dead horse.
But it seems that you, Doug, have been doing this for a living more than anyone else in here. Me? Never done psychometrics but have learned what little I know of statistics “on the job.”
This idea that a one percent change in the average of the “number of proficient students” is significant has me totally puzzled. I’ve been turning the problem around and around but I don’t get it. So I have no choice but to ask the following questions. And please excuse the set up. I just want to make sure that I am explicit about how I got to the questions.
Please forgive my ignorance but here it goes: let’s assume for the purposes of this discussion that the CST in, say, ELA was designed to generate scaled scores that, when graphed as a histogram, display a Gaussian distribution (aka the Bell Curve) with a mean of 360 and a standard deviation (SD) of 60.
The design of the test is not changed and given, with a different mix of questions, year after year. It is observed that the mean changes value, generally to higher values but the SD does not. This is interpreted to mean “there is academic growth” or, as the media so incorrectly puts it, “more children are at grade level.”
The graphs above are for averages of this “increase in proficient students.” Let’s reduce this to the simple and improbable case of “the percentage of proficient-and-above number of students is the same for all grades.” If that were the case, we can take a look at one of the grade distributions and see what has happened to it from year to year.
Table 1 above says that 57.2% of all students were above proficient in 2012 while 56.4% are in 2013.
Looking at the single distribution, which stands for all of them as they are identical, would then say that the average went up to 365 in 2012 and went down to 364 in 2013. (This calculation is made possible by the usual “standard normal distribution table found in many books and now in the Internet, as, for example, here.)
In all my experience in the physical sciences this would be well within measurement error. How can it be statistically significant in education psychometrics where the cohorts necessarily change, both in composition and schooling from year to year? How could one point shift in the average of a Bell Curve change the grade from a middlin’ C to an F? Are the tests administrations so stable from year to year that a one point change in their average is sufficiently educationally meaningful and allows you to stamp this year with an F?
I just can’t wrap my head around your explanation when I get down to the basics of how this simple number was calculated. Thank you in advance.
Doug McRae 11 years ago11 years ago
Manuel: All the discussions and manipulations dealing with scale scores and normal distributions are essentially irrelevant and introduce noise (rather than signal) to this test score interpretation issue. In 2000 and 2001, the cut scores for STAR CSTs (E/LA and Math) were set at a place where roughly 35 percent of the kids scored proficient . . . . those cut scores were set via a process where standards-setting panels followed an established process … Read More
Manuel: All the discussions and manipulations dealing with scale scores and normal distributions are essentially irrelevant and introduce noise (rather than signal) to this test score interpretation issue. In 2000 and 2001, the cut scores for STAR CSTs (E/LA and Math) were set at a place where roughly 35 percent of the kids scored proficient . . . . those cut scores were set via a process where standards-setting panels followed an established process to provide their judgments how many items correct on each CST constituted what they collectively opined was “proficient” performance, with these judgments made independently for each content area and grade level so the cut scores translated to varying percentages of kids scoring proficient but when aggregated across content areas and grade levels, the cut scores yielded the roughly 35 percent proficient statistic. Over the past 10-12 years, that statistic has increased to roughly 55 percent of the kids scoring proficient, in aggregate. That is what is interpreted as “gains” over time, and since it involves the total number of students taking STAR CSTs over all grade levels and content areas each year, that number is roughly 5 million per year. By simple substraction, namely 55 – 35, CA has seen about 20 percentage point increases over 10-12 years, or roughly 2 percent per year. Some years have seen higher growth [for instance, the 4.8 percent gains in 2005 which earned an “A++” on my GPA-like chart], while other years have seen lower percent gains [for instance, the +0.75 percent gain in 2004 which earned a “D-” on my GPA-like chart]. The one percent change in percent proficient for this very large group of students (5 million) is statistically significant due to the vary large denominator used for statistical significance calculations. A one percent change is not statistially significant for school or likely even district level data (with the possible exception of LAUSD with its large denominator). But as has been said quite a few times, statistical significance is not a good criteria for interpretation of aggregate test results, educational meaningfulness is a better criteria. For educationally meaningful, I fall back on observations from folks like like Bob Linn (U Colorado, retired) who opined some 10 years ago that percent proficient increases of 3-4 percentage points per year were good solid gains and represented the best we might expect from statewide assessment data involving very large aggregate data. Bob’s opinion was based on reams of statewide assessment data from multiple states that were included in the fine print of his academic article on the issue. That opinion comported with my own experience looking at reams of statewide assessment results over my 30+ years in the K-12 testing arena as of 10 years ago, and Bob’s analyses and opinions also confirmed my observation that percent proficient gains of roughly 2 points per year were about average gains for statewide assessment programs. Thus, 4 point gains were afforded an “A” in my GPA-like system, 2 point gains were afforded a “C” and 0 point gains were afforded an “F.” In another reply, I commented to Navigio where the expectation that standards-based tests would generate gains from year-to-year originated, as part of the conceptual basis for standards-based tests like our CSTs. The bottom line is this line of thinking and observation of real data leads to a grade of “F” when one looks at CA’s negative gain in 2013. The change from “C” in 2012 based on a +2.0 point increase to “F” in 2013 based on a -0.65 percent increase, a change of 2.65 percentage points, is undoubtedly statistically significant, but more importantly it is educationally meaningful. This change should not be swept under the rug as a minimal change, ’cause the numbers say it isn’t a minimal change. The use of an “A” to “F” grading system helps communicate this point.
Manuel 11 years ago11 years ago
Thank you!
Gary Ravani 11 years ago11 years ago
If there had been "less than one percentage point" gain "for all tests in all grades" that would be interpreted by the educational alarmist industry as "flat growth" which would have triggered reflexive accusations of the "crisis in the schools." But a "less than one percentage point" decline then it's obviously time for panic, the achievement sky is falling. Let us not forget the sacred and seminal text of the alarmist industry: A Nation at … Read More
If there had been “less than one percentage point” gain “for all tests in all grades” that would be interpreted by the educational alarmist industry as “flat growth” which would have triggered reflexive accusations of the “crisis in the schools.” But a “less than one percentage point” decline then it’s obviously time for panic, the achievement sky is falling.
Let us not forget the sacred and seminal text of the alarmist industry: A Nation at Risk. In the mid 1980s, after a disastrous period of poor decision making by industry management this document pretty successfully was able to scapegoat the schools for business community errors that led to a recession. Kind of a prelude to the recent economic crunch. ANAR cited slightly falling scores for 11th grade science as indicators of both educational and economic peril. Test scores of the time offered science, math , and reading scores for three grade levels, meaning there were nine sets of scores to consider. 11th grade science was the only set of score indicating any significant decline, so that what was the chief indicator of “falling skies.” A couple of years later the Sandia lab study indicated that ANAR was rubbish, but that study was ignored (some suggest repressed).
Let is also not forget that these are CST scores. CA, like a number of other states, is abandoning these tests because of their narrow focus, limiting critical thinking as an academic concentration, and unreliability at both ends of the performance scale. A number of districts have been piloting the new assessments and all teachers are aware they are coming shortly. The CSTs are yesterday’s news.
Finally, there is the issue of school funding. The NAEP, considered the “gold standard” for US assessments, clearly shows the highest performing states in the US are also the highest spending states (for education per child). The fact that they are also have the highest concentrations of unionized teachers will be considered a “coincidence” by some. CA’s spending per child is near the bottom in the nation though its NAEP performance is not, indicating pretty good bang for the educational buck.
Replies
el 11 years ago11 years ago
Not to mention that these scores are better than 2011. The horror.
Doug Lasken 11 years ago11 years ago
The increase in scores since 2003 can in part be attributed to the passage in 1997 of Prop. 227, which mandated English instruction for Hispanics (before Prop.227, Spanish speaking children studied in Spanish only), because it would take about six years for the beneficial effects of English instruction to appear in K-12 English scores. Regarding the slight decrease in recent years’ increases, along with “retired test publisher” McRae’s grade of F for this years’ scores, expect … Read More
The increase in scores since 2003 can in part be attributed to the passage in 1997 of Prop. 227, which mandated English instruction for Hispanics (before Prop.227, Spanish speaking children studied in Spanish only), because it would take about six years for the beneficial effects of English instruction to appear in K-12 English scores.
Regarding the slight decrease in recent years’ increases, along with “retired test publisher” McRae’s grade of F for this years’ scores, expect a torrent of blame for the decline on the current standards, along with breathless hope that Common Core will work where nothing else has. It better, because it’s costing us
$1 billion of the taxes we just levied on ourselves with Prop. 30, with probably another billion to go.
Reply
Replies
Manuel 11 years ago11 years ago
Really? Six years? I seem to recall, Mr. Lasken, that you were against bilingual education because it took 7 years to turn an English learner. Sure enough, there it is still in the Intertubes: "I have watched hundreds of Spanish-speaking children, fully capable of mastering English within a year, denied meaningful English instruction." Since all these children were dumped on, excuse me, taught according to "Structured English Immersion" since 1997, why would it take six years for … Read More
Really? Six years? I seem to recall, Mr. Lasken, that you were against bilingual education because it took 7 years to turn an English learner.
Sure enough, there it is still in the Intertubes: “I have watched hundreds of Spanish-speaking children, fully capable of mastering English within a year, denied meaningful English instruction.”
Since all these children were dumped on, excuse me, taught according to “Structured English Immersion” since 1997, why would it take six years for a such alleged beneficial effects to show up in the scores?
Incidentally, back in 2003, the number of proficient-and-above kids in, say,3rd grade classified as English learners in the US 12 months or more was 14%. In 2013, they are only 22%. In 2003, 23% of all tested students were classified as ELs with 12+ months. In 2013, it is 20%. Numbers like these show that Prop 227 did not do its job. People like me told you so then but you did not listen. Back then you were not willing to consider “I don’t know” as an answer. Oh, well…
Manuel 11 years ago11 years ago
oops… did not finish the first sentence during the revise pass. It should read:
“…because it took, on the average, 7 years to turn an English learner into a fully-certified Reclassified Fluent English Proficient, or so claimed Prof. Krashen.”
Gary Ravani 11 years ago11 years ago
Manuel:
Not just Krashen. Most other research suggests it take 5-7 years (under positive conditions) for motivated students to achieve L2 academic proficiency. It never did make sense for students to be sitting on their hands in the content areas for 5 to 7 years while they gained language proficiency. But not much “sense,” in terms of academic realities, applied when ideology and jingoism were the political weapons of choice used against bilingual education.
Manuel 11 years ago11 years ago
Oh, I know. I was just trotting out Steve because he became the piñata during that fight. But he bravely took it all and we have Mr. Lasken for fanning the vitriol. The catch, though, is that the rules to classify a student as RFEP back then are about the same they are now. Students at all levels have to demonstrate proficiency in the CELDT and the CST at at least a basic level. Plus elementary … Read More
Oh, I know. I was just trotting out Steve because he became the piñata during that fight. But he bravely took it all and we have Mr. Lasken for fanning the vitriol.
The catch, though, is that the rules to classify a student as RFEP back then are about the same they are now. Students at all levels have to demonstrate proficiency in the CELDT and the CST at at least a basic level. Plus elementary students must be getting a 3 or a 4 (the old B and A) in ELA, while secondary students have to get at least a C. It wasn’t that students couldn’t or can’t understand vernacular English. The gatekeeper has always been the tests.
So, yeah, I remember all the arguments. And it is ironic that we are now exhorted to be bilingual in the name of global competition but we are still tied to politically imposed monolingualism. I am sure you’ve heard this joke: “What do you call a person who speaks three languages? Trilingual. What do you call someone who speaks two languages? Bilingual. What do you call a person who speaks only one language? American.”
el 11 years ago11 years ago
California class size reduction started in 1996. Why would you attribute score increases to english-only instruction rather than class size reduction, which started at approximately the same time?
navigio 11 years ago11 years ago
There are so many things about our testing regime that I fail to comprehend. Since this may be the last time we ever talk about it, I guess I should mention some of them. Probably the most important is that in our 'failing schools', proficiency rates are up huge since 2003. This is particularly so for 'disadvantaged subgroups'. While we still like to classify those schools as failing because we look at things in absolute terms, … Read More
There are so many things about our testing regime that I fail to comprehend. Since this may be the last time we ever talk about it, I guess I should mention some of them.
Probably the most important is that in our ‘failing schools’, proficiency rates are up huge since 2003. This is particularly so for ‘disadvantaged subgroups’. While we still like to classify those schools as failing because we look at things in absolute terms, we should not forget that we have not significantly changed the ‘input’ to the system in that decade. The reason for that increase is not obvious, but its something we should not forget has happened.
Then another is the very simple fact that comparing numbers over a decade isn’t very appropriate. Probably the most important reason is that the kids in those different years had varying levels of ‘influence’ put on them from the things we like to believe impact test score changes. If you look at a 2nd grader in 2005, that will be a student who spent their entire public education career (a measly 3 years) under the influence of a ‘test-based system’. But an 11th grader in the same year only spent 3 of their 12 years under that system, with their most formative years having been from the lated 90’s. If in fact we assume our test-focused policy has some influence, then it must be that the lack of that influence is something that will have a legacy in the results of those older kids. If that is true, we might expect the deviation between a 2nd and 11th grader’s scores to be much larger in earlier years than in later ones (though exactly the opposite appears to be the case).
This not only impacts something like overall, long-term proficiency rates, but also the impact of changes in education policy such as funding levels, funding use flexibility, class size, curricular changes, even test changes, etc, etc. I expect the flexibility that was provided as a result of the past handful of years of budget cuts would only have a measurable impact on test results after some number of years of that policy (maybe we are now seeing; maybe we are now seeing something else?). Obviously there are some things that would happen right away, but the impact of these influences must work against other, historical influences, some of which are slower to be countered.
Personally, I am not even sure we have the kind of data needed to do such statistical separation of factors.
And then finally, my pet peeve: disaggregation. In recent years we have shown some promise by realizing that disaggregating students on multiple factors at the same time might be a good idea (recent introduction of socioeconomic dis/advantaged by ethnicity). But we still dont do this enough. We dont disaggregate ELs by ethnicity or socioeconomic status. We dont disaggregate disability status by ethnicity (even though we know classification rates are disproportionate for different ethnicities). And even the socioeconomic disaggregation by ethnicity fails to take those other metrics into account. I have seen schools in which a third of the African American students were labelled as special ed, but less than 10% of whites were. Comparing the proficiency rates of those ethnicities straight-up when defining ‘achievement gap’, with no attempt to qualify the impact of disability status (especially when the differences between SWD and non-SWD can be on the order of 400 points in API at upper grades in some schools!) is a horrific disservice to transparency.
Anyway, the things that all these single, overarching numbers hide are the gaps. While we like to talk about racial gaps, the fact is that socioeconomic gaps, disability gaps, native language gaps and especially parent education gaps exist for all ethnicities/races. And some of these gaps are huge. Some of these we can get from public data, but for most of them we must rely on district data (ie the public will never really know them).
And maybe most importantly, instead of using these results to identify need, we will use positive trends to laud policy-makers and district administrators, but will use negative trends to vilify teachers. And all the while, even the statisticians will continue to be mystified about whether there is anything to glean from this data at all.
Replies
Manuel 11 years ago11 years ago
A true story: when I talked to a "highly placed Capitol staffer" on my CST histograms about two years ago, he confirmed to me that the "legislators" were warned that the distributions were not going to change over time if the test was to be designed the way it has been. They did not fully understand the advice, he said. He also said that this was the time to bring this to the front because … Read More
A true story: when I talked to a “highly placed Capitol staffer” on my CST histograms about two years ago, he confirmed to me that the “legislators” were warned that the distributions were not going to change over time if the test was to be designed the way it has been. They did not fully understand the advice, he said. He also said that this was the time to bring this to the front because the law was sunsetting. Of course, we are now faced with a new set of assessments that we have no idea how they are designed and/or how they are going to work out.
All we hear is “trust us.” Based on what has happened over the last ten years, I don’t think they have earned that trust. Hell, if I knew then what I know now I’d probably would have opted my children out.
Doug McRae 11 years ago11 years ago
Kathy -- Good post on the STAR 2013 results in general. But I have to note that the forward looking sections [4th paragraph on CSTs being phased out this year, the detail at the end of the post listing CSTs not to be given in 2014] are based on SPI's recommendations that have not been approved as yet by other elements of CA's K-12 policymaking structure. It is true the SPI's recommendations have … Read More
Kathy — Good post on the STAR 2013 results in general. But I have to note that the forward looking sections [4th paragraph on CSTs being phased out this year, the detail at the end of the post listing CSTs not to be given in 2014] are based on SPI’s recommendations that have not been approved as yet by other elements of CA’s K-12 policymaking structure. It is true the SPI’s recommendations have been aggressively promoted by CDE staff, but again they are only recommendations. They are being carried by AB 484 (Bonilla) in the legislature, and the legislature likely won’t be finished with its input on the recommendation until Sept, and the Gov likely won’t sign or veto 484 until Oct. From this perspective, the post does a disservice by citing current recommendations for future statewide assessments as certain changes rather than policy recommendations that in fact are just works-in-process. Doug
Replies
Kathy Baron 11 years ago11 years ago
Doug, You're correct. It's based on Assemblywoman Susan Bonilla's bill, AB 484, passing and being signed into law. The bill passed the assembly on a nearly party line vote (Assemblywoman Diane Harkey, R-San Juan Capistrano voted with democrats). The bill's first vote in the Senate, on the education committee, was 7-1, also along party lines. Of course that's no guarantee that it will pass the full Senate, but does provide a glimpse into the way … Read More
Doug,
You’re correct. It’s based on Assemblywoman Susan Bonilla’s bill, AB 484, passing and being signed into law. The bill passed the assembly on a nearly party line vote (Assemblywoman Diane Harkey, R-San Juan Capistrano voted with democrats). The bill’s first vote in the Senate, on the education committee, was 7-1, also along party lines. Of course that’s no guarantee that it will pass the full Senate, but does provide a glimpse into the way the way lawmakers are leaning on AB 484.
Paul Muench 11 years ago11 years ago
Math scores did decline from 2003 to 2004. And 2007 was a flat year. So there have been other variations since the beginning of testing. At some point we have to expect diminishing returns given we’re not substantially increasing the inputs. Although this does leave us with the possible legacy that cutting education funding had little bottom line impact on students. But we’ll never know for sure as this regime is ending.
Manuel 11 years ago11 years ago
I've said it before: I know enough statistics to smell a rat. Or at least a mouse. How can one take the CST results in ELA for 10 grades, add them up and come up with one single set of numbers for the entire state? Isn't that like mixing macintoshes with galas? They are both apples, but they are not the same. What I think we are seeing on the test results for this year is "regression … Read More
I’ve said it before: I know enough statistics to smell a rat. Or at least a mouse.
How can one take the CST results in ELA for 10 grades, add them up and come up with one single set of numbers for the entire state? Isn’t that like mixing macintoshes with galas? They are both apples, but they are not the same.
What I think we are seeing on the test results for this year is “regression to the mean.” After all, if the proficient cut off point is set at the average, administration of the tests should take the results to 50/50. It is the nature of the beast.
Replies
Doug McRae 11 years ago11 years ago
Manuel: As indicated previously, the CSTs are not designed to take results to 50/50 over time . . . they are designed to track progress against a fixed achievement standard and there is no inherent statistical reason that scores cannot continuously increase indefinitely. In fact, the GPA-like grading system I started to use a number of years ago was based on Bob Linn's observation perhaps 10 years ago that good solid annual gains … Read More
Manuel: As indicated previously, the CSTs are not designed to take results to 50/50 over time . . . they are designed to track progress against a fixed achievement standard and there is no inherent statistical reason that scores cannot continuously increase indefinitely. In fact, the GPA-like grading system I started to use a number of years ago was based on Bob Linn’s observation perhaps 10 years ago that good solid annual gains from large statewide assessment programs are about 3 to 4 percentage points a year, not unlike a 3.0 to 4.0 GPA. If one takes a GPA grading system with 4 point gains given an “A”, 3 point gains given a “B”, 2 point gains given a “C”, and 1 point gains given a “D”, then negative gains have to be given an “F”. De numbers are de numbers . . . . ., no rat or mouse in sight or smell. Your “regression to the mean” analogy assumes the mean is a0 point gain; that ain’t true. If anything a regression to the mean explanation would use perhaps 2 point gains as expected average gains over time. The STAR decreases this year are not explained by any internal statistical black box.
Manuel 11 years ago11 years ago
Doug, yes, that is what we have been told about the CST design. Yet, if the average for each cohort is plotted (straight out of the Technical Reports) as a function of time none of the the "best fit" lines show the "growth" that you refer to. They just don't. Also, if "there is no inherent statistical reason that scores cannot continuously increase indefinitely," why have the score distributions remain so, I don't know, static? By … Read More
Doug, yes, that is what we have been told about the CST design. Yet, if the average for each cohort is plotted (straight out of the Technical Reports) as a function of time none of the the “best fit” lines show the “growth” that you refer to. They just don’t.
Also, if “there is no inherent statistical reason that scores cannot continuously increase indefinitely,” why have the score distributions remain so, I don’t know, static? By now, I would expect teachers to have figured out how to “teach to the test” without actually cheating. Yet, they haven’t. Even when extensive test prep is done, as was done at Hart Elementary for several years, the API did not go to the 900s. So what is really going on behind the closed doors of ETS?
Maybe ETS should explain why that is. I can only speculate based on what the published data tells me.
I do know one thing: when the STS were “reset” a few years ago, “ETS conducted a performance standard setting” for this tests. As a result, SBoE reset the cut-off points based on predicted percentages of achievement: the predicted proficient and above rates were 38, 39, and 38% for 2nd, 3rd, and 4th grade in ELA and 53, 49, and 43% for 2nd, 3rd, and 4th grade in math. Who in their right mind designs a test that is scored like this, especially one that is standardized? And, yes, the documents are all available here. It is Item 15.
el 11 years ago11 years ago
I had to view source to get Manuel’s link, which is http://www.cde.ca.gov/be/ag/ag/yr09/agenda0309.asp
This is what ETS writes about cut scores:
http://www.ets.org/Media/Research/pdf/Cut_Scores_Primer.pdf
navigio 11 years ago11 years ago
There is a bug in the css on this page. if a link is in the last line of the comment, it is 'overlapped' by the area that contains the reply link. There are two ways to 'fix' this: - never put a link anywhere it will be in your last line (I add a newline and then a '-' when I have a link near the end (see example below at the end of this … Read More
There is a bug in the css on this page. if a link is in the last line of the comment, it is ‘overlapped’ by the area that contains the reply link. There are two ways to ‘fix’ this:
– never put a link anywhere it will be in your last line (I add a newline and then a ‘-‘ when I have a link near the end (see example below at the end of this post). A space wont work because spaces are truncated off of comments before they are posted).
– modification of the css by the edsource team (they know about this, but its ‘on their to-do list’.. 😉 )
http://www.cde.ca.gov/
–
Manuel 11 years ago11 years ago
Sorry about that. I try to make sure that the links are properly given (do note that the "here" is in different color!) but the Word Press software seem to have a gremlin. In fact, it may have hit you too: the link does not respond to clicking! I can't even highlight-and-drag-and-drop! (Hey, would you look at that! navigio knows about the gremlin!) OK, skimmed it and it looked awfully familiar. I've seen this movie before, … Read More
Sorry about that. I try to make sure that the links are properly given (do note that the “here” is in different color!) but the Word Press software seem to have a gremlin. In fact, it may have hit you too: the link does not respond to clicking! I can’t even highlight-and-drag-and-drop! (Hey, would you look at that! navigio knows about the gremlin!)
OK, skimmed it and it looked awfully familiar. I’ve seen this movie before, I think. It starts by telling the reader that there are at least eight (!!) ways of setting cut scores, all of them apparently equivalent. From there, each method is described with lots and lots of caveats.
Nevertheless, I kept looking for a justification of setting the “proficient” cut-off point at the average of the score distribution, as seems to be done in the CSTs, but did not find it.
Finally, the “Conclusion” says it all:
“It is impossible to prove that a cut score is correct. Therefore, it is crucial to follow a process that is appropriate and defensible. Ultimately, cut scores are based on the opinions of a group of people. The best we can do is choose the people wisely, train them well in an appropriate method, give them relevant data, evaluate the results, and be willing to start over if the expected benefits of using the cut scores are outweighed by the negative consequences.”
Really? Is there proof anywhere that this was done at the dawn of the CSTs? Is there proof that it was ever revised? Have educators been consulted on whether the questions included in the tests make sense to them?
I have to admit, el, that several years ago I looked for a document like this so I could make some sense of what I was finding about the CST scores. A tip of the hat for providing this link.
And, navigio, thanks for that very valuable tip. I’ll keep it in mind.
navigio 11 years ago11 years ago
If no one can explain the reason scores dropped (or, I am beginning to believe, the reasons scores ever increase), then maybe the mean is a 0 point gain. What do we have to base the assumption on that a gain is supposed to occur (other than that it has been mostly occurring in the past)? And if that is the reason, and as one of the ETS links suggest, actual results are a … Read More
If no one can explain the reason scores dropped (or, I am beginning to believe, the reasons scores ever increase), then maybe the mean is a 0 point gain. What do we have to base the assumption on that a gain is supposed to occur (other than that it has been mostly occurring in the past)? And if that is the reason, and as one of the ETS links suggest, actual results are a necessary feedback loop to the cut score process, why is it not a problem that cut scores are ‘reset’ (if/when they are)? Or alternatively, that new questions chosen are a reflection of previous years’ answers (ie a different way of achieving a modified distribution over a static cut score)?
dad 11 years ago11 years ago
The state funds it's prison population 7x what it funds it's students...let's just keep growing the prison population & fund schools less since the answer to the 'problem' is simple: just lower the standards for the test! Voila more kids passing-keeps the prison guard union & the teachers union both happy, while we have a(nother) generation of poorly educated populace who can barely think for themselves, much less read or write. So what if we fall … Read More
The state funds it’s prison population 7x what it funds it’s students…let’s just keep growing the prison population & fund schools less since the answer to the ‘problem’ is simple: just lower the standards for the test! Voila more kids passing-keeps the prison guard union & the teachers union both happy, while we have a(nother) generation of poorly educated populace who can barely think for themselves, much less read or write.
So what if we fall further behind then the rest of the world!??!? We’re the USA, We’re CA, we’re the best!! Just follow the model of Doug Smith and the Los Altos School board-distract your constituents by demonizing anyone who wants to alter/update their historically good schools to adapt to the 21st century and global competition.
navigio 11 years ago11 years ago
The change in results from year to year seem odd, and not like something that would clearly represent some change in statewide policy. Doug, how much of this variability can be attributed to the design of the tests? Since the questions are not all identical from year to year, it seems we can only try to get perfectly correlated results. Is there an expected value below which any change can be considered statistically insignificant? Personally, I … Read More
The change in results from year to year seem odd, and not like something that would clearly represent some change in statewide policy. Doug, how much of this variability can be attributed to the design of the tests? Since the questions are not all identical from year to year, it seems we can only try to get perfectly correlated results. Is there an expected value below which any change can be considered statistically insignificant?
Personally, I think it’s possible that the shift to common core could have something to do with these numbers. In of own district, some schools ‘piloted’ methods that were used only partially in other schools, or not at all. Since the associated change in instruction was worth mentioning, it seems obvious it could have impacted test results. It would be interesting to try to quantify that but I don’t think it will be possible to get that data in a way that would allow that.
Replies
Doug McRae 11 years ago11 years ago
Navigio: I'm not aware of anything with this year's STAR that would explain a decrease in scores. In fact, this year's STAR involved using previously used intact forms of tests rather than new forms with new items to replace retired items (a change approved early 2012 to speed turnaround time of results for local districts) which if anything might explain an increase in scores but certainly not a decrease. Also, I'd agree with … Read More
Navigio: I’m not aware of anything with this year’s STAR that would explain a decrease in scores. In fact, this year’s STAR involved using previously used intact forms of tests rather than new forms with new items to replace retired items (a change approved early 2012 to speed turnaround time of results for local districts) which if anything might explain an increase in scores but certainly not a decrease. Also, I’d agree with Paul Warren’s comment that the Common Core content is quite similar to our 1997 content standards, adding that CC is perhaps a little more rigorous in E/LA but less rigorous in Math [due mainly to the lack of full Algebra standards in the middle school CC for kids ready to take Algebra in the middle school grades]. This view would argue that the “old” STAR tests continue to validly reflect expected academic achievement in California, notwithstanding the shift to CC instructional practices. I’ve heard a number of CA local district folks say that the CC does not reflect a change in content as much as it reflects expected changes in instructional practices. Dan Koretz (widely respected assessment guy now at Harvard) was quoted recently in EdWeek (I believe) saying much the same thing. To possibly explain the dip in scores, I’d say the fiscal downturn explanation provided by the SPI has more credibility. Focus on a single year results is always a bit dangerous. Over time, however, the first 8 years of STAR had average gains of 2.68 percentage points, which approaches the 3-4 point gains that highly regarded testing guy Bob Linn (U Colorado, retired) called “good solid” gains for large statewide assessment programs some 10 years ago. CA’s STAR gains for the last four years, however, average 1.46 percentage points and that is a substantial fall off from the first 8 years. It is the last four years of results that led me to call CA’s progress “stagnant” in the 5-page analyis I did that was linked by the post.
Josephine 11 years ago11 years ago
I suspect the decrease in scores is related to implementation of Common Core. In my child's classroom last year the math textbook was rarely used as her teacher and the other 4th grade teachers underwent training with a math specialist to get up to speed with the new standards and rather than teach from the textbook relied on a variety of other sources. The curriculum appeared to be in transition as the staff … Read More
I suspect the decrease in scores is related to implementation of Common Core. In my child’s classroom last year the math textbook was rarely used as her teacher and the other 4th grade teachers underwent training with a math specialist to get up to speed with the new standards and rather than teach from the textbook relied on a variety of other sources. The curriculum appeared to be in transition as the staff made the transition and my observation was my child’s class did not cover all the same areas her older siblings did when they were in 4th grade. Yet the Star test content remained pretty much the same. So I’m not surprised that there were some differences in Star scores. But the differences seem very small so that’s good news.
navigio 11 years ago11 years ago
Yeah, I considered this as well. In our district only some teachers started 'implementing' common core last year, so it should be possible to verify whether those teachers' classes were worse (no, I dont expect to see such an analysis, but it sure as heck would be nice). However, something else I noticed: in our district (mid-size; just under 20,000 students) the results were much worse than the CA average, and there was about a … Read More
Yeah, I considered this as well. In our district only some teachers started ‘implementing’ common core last year, so it should be possible to verify whether those teachers’ classes were worse (no, I dont expect to see such an analysis, but it sure as heck would be nice). However, something else I noticed: in our district (mid-size; just under 20,000 students) the results were much worse than the CA average, and there was about a 20/80 split at the elementary level (20 up, 80 down), but at middle school, all results were down, and in high school all results were flat or up. Its comforting to think those results could just be random (20,000 students is probably not enough to get an accurate read, especially spread across almost 30 schools), but they seem a bit too consistent for randomness. But that’s just me.
doug 11 years ago11 years ago
Had the same observation for our district in the 4th grade. CCSS is missing plenty of pre-algebra that was in 4th grade. The teachers in my son's class were so into preparing for the change, that they taught very little during the year. I was amazed that HW almost disappeared and intro algebra was replaced with 3rd grade math facts. I made up the difference in the house and my son sailed through the STAR … Read More
Had the same observation for our district in the 4th grade. CCSS is missing plenty of pre-algebra that was in 4th grade. The teachers in my son’s class were so into preparing for the change, that they taught very little during the year. I was amazed that HW almost disappeared and intro algebra was replaced with 3rd grade math facts. I made up the difference in the house and my son sailed through the STAR questions in stats and algebra with an “advanced” score. We are continuing the 1997 standard math with a private tutor.