
Black teachers: How to recruit them and make them stay

Lessons in higher education: What California can learn

Keeping California public university options open

Superintendents: Well-paid and walking away

The debt to degree connection

College in prison: How earning a degree can lead to a new life
Q: When did California stop using the tier system? What does that mean for schools?
A: California retired the tier system June 15 after 20 million vaccines were administered, ending most of the Covid-19 safety restrictions. Though face coverings are no longer required in most settings in California, individuals will still be required to wear masks inside K-12 schools, childcare facilities and other youth settings regardless of whether or not they are vaccinated, according to a California Department of Public Health guidance. issued June 9. The guidance states that the rules could change for K-12 schools, since the state’s updated operating guidance for schools is “forthcoming.” That will follow the U.S. Centers for Disease Control’s updated operational guidance for K-12 schools.
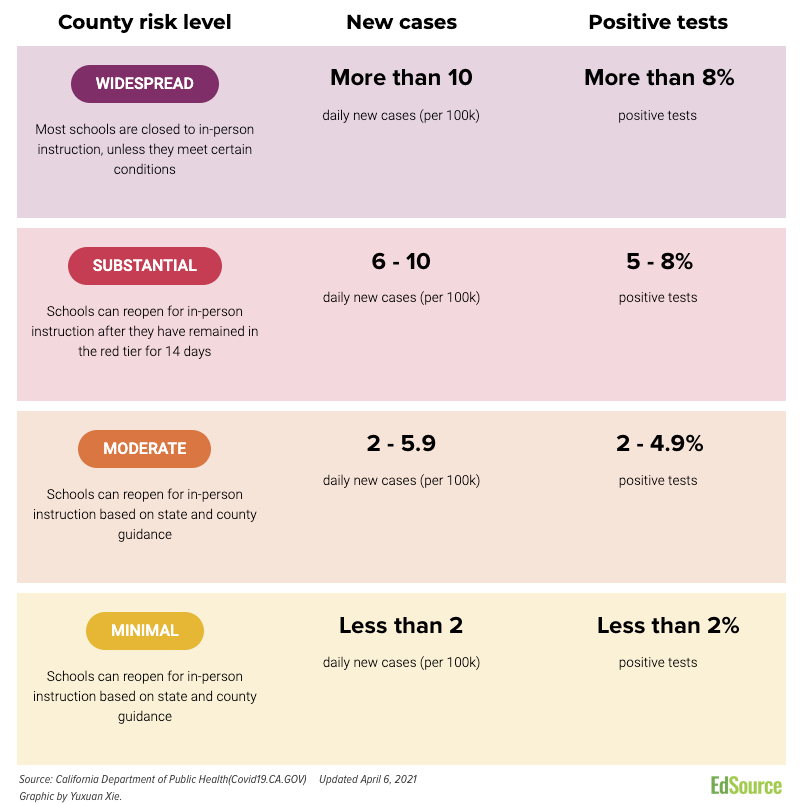
Q: What was the color-coded county tracking system and how did it affect schools?
A: The four-tiered, color-coded system ranked counties by the average daily number of new Covid-19 cases and the percentage of positive cases out of the total number of tests administered, both averaged over seven days.
Its principal impact was on when businesses could reopen. But it also had a major impact on the ability of schools to reopen for in-person instruction. For months, if a county was in the purple tier, schools in that county could not open for in-person instruction for regular classes.
Q: What did the colors stand for?
A: Purple, or Tier 1, indicated that the virus was widespread in the county — with more than seven cases per 100,000 residents or more than 8% of tests results reported positive over seven days. Red (Tier 2) indicated “substantial” spread of the virus, while orange (Tier 3) indicated “moderate” spread and yellow (Tier 4) indicated “minimal” spread of the virus in the county.
If one of the two metrics was higher than the other, the state would assign the county to the color associated with the highest rating. For example, if a county reported six cases per 100,000, but a 9% positivity rate, it would have had a purple rating.
The guidance on school reopenings changed several times over the course of the pandemic. In early March, the state began to tie the criteria defining tier colors to increases in the number of Californians who had been vaccinated.
The measure changed again April 6, when the number of vaccinations reach a new threshold: 4 million shots administered in the state’s lowest income communities. The new parameters enabled counties to shift more quickly from purple and red tiers to the less restrictive orange, yellow and eventually a new “green” tier, when all Covid restrictions would be dropped.
Q: Under the last modifications, were schools allowed to open in the purple tier?
A: Yes, but only if Counties had an “adjusted case rate” of fewer than 25 new cases per 100,000 for at least five consecutive days in order to open for K-6 grades, and less than seven for grades 7-12.
Under the previous system, the case rate had to be in the red zone to open, seven cases per 100,000 or under — nearly four times more stringent than the updated standard.
All schools offering in-person instruction in Spring 2021 were required to post a Coronavirus Safety Plan by Feb. 1. In addition, they were required to post a dashboard listing Covid-positive cases of students and staff at each site that was open. Check out this dashboard from Capistrano Unified, for example, as well as its school safety plan.
Schools that hadn’t yet started offering in-person instruction but wanted to had to post their Coronavirus Safety Plan and submit it to their local health officer and to the state’s Safe Schools for All team for approval.
Q: Where can I find the “adjusted case rates” for my county?
A: Go the state’s Blueprint for a Safer Economy webpage, and click on the California Blueprint Data Chart, an Excel sheet, which lists the adjusted rates.
Q: What did a Covid-19 Safety Plan consist of?
A: It showed that the district or local education authority is following the very extensive Cal/OSHA COVID- 19 Prevention Program and the COVID-19 School Guidance Checklist issued by the California Department of Public Health. While developing the safety plan, districts were “strongly recommended” to consult with labor, parent, and community organizations. See Page 9 of the Jan. 14, 2021, CDPH guidance.

Panelists discussed dual admission as a solution for easing the longstanding challenges in California’s transfer system.

A grassroots campaign recalled two members of the Orange Unified School District in an election that cost more than half a million dollars.

Legislation that would remove one of the last tests teachers are required to take to earn a credential in California passed the Senate Education Committee.

Part-time instructors, many who work for decades off the tenure track and at a lower pay rate, have been called “apprentices to nowhere.”


Comments (24)
Comments Policy
We welcome your comments. All comments are moderated for civility, relevance and other considerations. Click here for EdSource's Comments Policy.
Roger Clarke 3 years ago3 years ago
Where is there information on when schools can open with full classes and 5 days of instruction?
Peter 3 years ago3 years ago
Question: There is no explanation on what tier masks are not mandatory.
Joan Hasselgren 3 years ago3 years ago
So orange and yellow are the same for schools to re-open for in-person education. So San Francisco should be able to re-open all their schools to in-person education. Correct?
Keldog 3 years ago3 years ago
This was great – very informational.
Thanks for having it!
Robin Cole 3 years ago3 years ago
The new CDC guidelines for re-opening schools have categories and color codes of community spread that are less stringent than California's categories. Is there any indication that California might adopt the CDC's categories? For instance the CDC recommends that if total new cases per 100,000 persons in the past 7 days is 50-99, that would be in the Moderate/Red category and CDC recommends that Middle/High Schools could go to school in person. … Read More
The new CDC guidelines for re-opening schools have categories and color codes of community spread that are less stringent than California’s categories. Is there any indication that California might adopt the CDC’s categories? For instance the CDC recommends that if total new cases per 100,000 persons in the past 7 days is 50-99, that would be in the Moderate/Red category and CDC recommends that Middle/High Schools could go to school in person. That same 50-99 case level category is considered Purple in California. The tiers in CA are so stringent that a county would be considered Low/Blue in the CDC matrix – but Red in the CA blueprint. I hope someone is looking at those new CDC guidelines and will research how CA could align themselves to CDC standards.
Ken 3 years ago3 years ago
When will special needs programs open up? My daughter attends the ARC of San Diego in San Marcos, CA, & no one there can answer my question. They close program on March 17, 2020. I’m sure I’m not the only parent/caregiver who would like to get answers. Thank you
karen vk 3 years ago3 years ago
Can you clarify second to the last paragraph: Is it 7 days w/less than 25 cases per 100,000 or 7 cases per 100,000 for 5 day in order for schools w/ 7-12 grades to reopen ??
Replies
John Fensterwald 3 years ago3 years ago
Karen:
The 25 new-case rate you are referring to is the threshold that would permit K-6 elementary schools to reopen in the purple tier. Middle and high schools that aren’t already operating cannot open in the purple tier. Rates for them have to fall below 7 cases per 100,000, which would place a county in the red tier.
Hope that helps.
Christina Haworth 3 years ago3 years ago
Our children are essential. Open the schools. If the current teachers won’t return, then hire new teachers.
John Parker 3 years ago3 years ago
Unfortunately, it doesn't look like any high school sports will be played for the remainder of this school year. To get into the red tier each county needs less than 7 daily positive tests per 100,000 residents and a less than 8% positivity rate. It is easy to get below the 8% positivity rate, but with how easy and ubiquitous testing has become and with the sheer volume of people traveling despite the … Read More
Unfortunately, it doesn’t look like any high school sports will be played for the remainder of this school year. To get into the red tier each county needs less than 7 daily positive tests per 100,000 residents and a less than 8% positivity rate. It is easy to get below the 8% positivity rate, but with how easy and ubiquitous testing has become and with the sheer volume of people traveling despite the travel ban, way too many asymptomatic people are getting tested daily yielding a much higher number of daily new cases. Some of these are false positives.
Using Santa Clara county as an example, it has 2 million residents so it needs to get below 140 daily positive tests to move back to the red tier. Right now SC county is averaging 10 times that. The daily new cases threshold must be raised or we won’t move back to the red tier any time soon and forget about sports.
Don’t test unless you have good reason and are concerned for yourself or your immediate contacts!
Marta L. Wallace 3 years ago3 years ago
Currently, California guidelines state that if a county is in the red zone and students return to school, then even when/if the county returns to the purple zone, schools will remain open. Most other places of employment will have to close or seriously curtail their business in the interest of public health. I understand that students face less harm from Covid 19, but there will be a large number of adults on campus thrown … Read More
Currently, California guidelines state that if a county is in the red zone and students return to school, then even when/if the county returns to the purple zone, schools will remain open. Most other places of employment will have to close or seriously curtail their business in the interest of public health.
I understand that students face less harm from Covid 19, but there will be a large number of adults on campus thrown together in unsafe working conditions. Why does our state value the lives of school staff members (janitors, office administrators, teachers and instructional assistants) so little? Who will teach the kids when the teachers become ill? We knew the hours would be long and the pay low when we signed up. We stand up for students when we suspect child neglect or abuse. When Sandy Hook occurred, we agreed to protect children from malevolent gun wielders. When the pandemic started, we doubled our already long days and weeks to upend our teaching systems, learn 5 to 10 new tech platforms and teach both students and parents how to use them so that we could bring high quality remote education to students.
Asking us to risk our lives during known outbreaks of Covid is asking one thing too many. Play fair, California!
Replies
Noelle 3 years ago3 years ago
I totally agree with the points you made. Safety should remain the top priority. Thank you for standing up for teachers!
Jan 3 years ago3 years ago
Does not do me a lot of good. You need to put the world Purple, Red, etc, in the chart. I am color blind. Since my county is purple, I want to see what that means. Newsom or whoever does not get – We cannot all see colors. Off to another site.
DR Michael Neal 4 years ago4 years ago
It’s my understanding that if someone comes in and test positive for the coronavirus, then comes in a few days later and test positive again both of those tests are considered new cases. This is absurd if it is true? Also is there an argument for passive immunity? I just don’t trust the way the numbers are gathered, I would appreciate some reassurance.
SANDRA L SWITZER 4 years ago4 years ago
“Cases” is never clearly defined but is apparently being extracted from positive tests. A “case” is not someone hospitalized, not even necessarily symptomatic. It is a false standard and the state guidelines are ludicrous. Thank God lawsuits are finally being brought challenging the out-of-control power being grabbed by governors and local officials. The manmade nightmare of the misguided shutdowns must end.
Replies
Angelina 3 years ago3 years ago
Sandra: The safety of everyone is at stake, you probably don't have anyone close to you contracting Covid 19 or dying from it, and I hope you don't experience the suffering that comes with it. It's important that schools reopen, but it should be when its save for the kids, the teachers and everyone else. If schools are not prepared to reopen, this will cause another closure. We have to learn from … Read More
Sandra: The safety of everyone is at stake, you probably don’t have anyone close to you contracting Covid 19 or dying from it, and I hope you don’t experience the suffering that comes with it.
It’s important that schools reopen, but it should be when its save for the kids, the teachers and everyone else. If schools are not prepared to reopen, this will cause another closure. We have to learn from other countries going through the same thing. We have countries like Australia with more restrictions than the USA and have the the pandemic under control. On the other hand we have countries like England and France that lifted the restriction and now have another strength infection spreading faster than ever. We have to wait a little longer.
Frank J Rodriguez 4 years ago4 years ago
Change the color code system to a square box with lines horizontal lines running through it start up with 54321 then an empty box. Color blindness prevalent thing. Lines would be a lot less perplexing.
Jeff H Shasta County, Ca. 4 years ago4 years ago
Shasta County is going Purple as of October 9th, due to 123 new cases at Bethel Church, another 60 case at Windsor Retirement Home owned by Bethel Church. And another 60 cases today alone totaling 270 in Shasta County.
Replies
Theresa Harrington 4 years ago4 years ago
Here are more details about what is going on in Shasta: https://www.sfgate.com/bayarea/article/Shasta-County-outbreak-highest-positivity-rate-15631004.php?utm_source=newsletter&utm_medium=email&utm_content=briefing&utm_campaign=sfg_thedaily&stn=nf&sid=5e99e99133ebbd7335035fe5
Eric Henderson 3 years ago3 years ago
Thank you for that link. It’s very helpful.
Debra 4 years ago4 years ago
Back in March, the week before we were finally allowed to be at home, I had my caseload which has a significant amount of students that will cough, wipe their nose on you or the table while we try to teach skills from their IEP. It amazes me that the board members are thinking the K-5 are a safe group; are they considering the special needs kiddos that have no concept of what is appropriate … Read More
Back in March, the week before we were finally allowed to be at home, I had my caseload which has a significant amount of students that will cough, wipe their nose on you or the table while we try to teach skills from their IEP. It amazes me that the board members are thinking the K-5 are a safe group; are they considering the special needs kiddos that have no concept of what is appropriate regarding masks, distancing, washing hands and basic boundary awareness with their peers/teachers?
SD Parent 4 years ago4 years ago
This one-size-fits-all approach to counties of vastly different sizes doesn't work well. Irresponsible behavior by 18-22 year old students from San Diego State University (which was largely online-only, with very limited in-person courses) have already caused 878 SDSU students to test positive for COVID-19. This SDSU-affiliated COVID-19 hotspot represents 22% of all COVID-19 positive tests in the past 14 days and nearly pushed the entire county of San Diego--with its more than 3.3 … Read More
This one-size-fits-all approach to counties of vastly different sizes doesn’t work well.
Irresponsible behavior by 18-22 year old students from San Diego State University (which was largely online-only, with very limited in-person courses) have already caused 878 SDSU students to test positive for COVID-19. This SDSU-affiliated COVID-19 hotspot represents 22% of all COVID-19 positive tests in the past 14 days and nearly pushed the entire county of San Diego–with its more than 3.3 million people spread over more than 4,500 square miles–back into Tier 1 (purple), further jeopardizing not only the local economy with more restrictions on businesses but forcing half a million TK-12 students )and their parents) to remain at home, subject to sub-par “distance learning.”
Explain how the state’s tiered rating system for such a large county–which would keep students home in school districts like Oceanside Unified or Vista Unified, which are located more than 40 miles away from SDSU’s campus–makes sense?
Under this one-size-fits-all approach and a waiver process that only applies to elementary school districts, young students who are unlucky to be part of a unified school district will continue to have poor prospects for in-person instruction this school year.
University of California at San Diego and University of San Diego students returned over the weekend, so now the entire county (hovering at 6.9 COVID-10 cases per 100,000 residents) holds its breath to see if irresponsible behavior by more college students will outstrip the efforts of millions of residents who are following social distancing and face mask guidelines in an effort to reopen schools.
John Peter Valentine 4 years ago4 years ago
What businesses can open in Tier 2?
Replies
Theresa Harrington 4 years ago4 years ago
Here’s a link with more details about what can open in each tier: https://www.cdph.ca.gov/Programs/CID/DCDC/CDPH%20Document%20Library/COVID-19/Dimmer-Framework-August_2020.pdf