


Black teachers: How to recruit them and make them stay

Lessons in higher education: What California can learn

Keeping California public university options open

Superintendents: Well-paid and walking away

The debt to degree connection

College in prison: How earning a degree can lead to a new life

California’s largest school district on Wednesday publicly released new data measuring how its students progress from year to year.
Los Angeles Unified, which serves more than 600,000 students, published what are known as academic growth data as part of a new online data portal called School Information+, becoming the latest district in the state to share the data.
The new platform gives each LA Unified school a growth score from 1 to 100 in both math and English based on how much students improved from 2018 to 2019 on Smarter Balanced tests in those subjects. A score of 50 is considered average growth and higher scores signal better growth.
In some cases, Los Angeles schools that are low-performing on traditional proficiency measures are among the schools showing the highest rates of growth, according to the new data.
For example, the data show that students at Andres and Maria Cardenas Elementary in the central San Fernando Valley and Hillery T. Broadous Elementary in the northern San Fernando Valley grew at above-average rates in math and English — even as fewer than 35 percent of students at those schools are proficient in those subjects. Both those schools also enroll high numbers of low-income students, with more than 90 percent of students at each qualifying for free or reduced-price lunch.
Meanwhile, some schools that are considered high-performing in proficiency show below-average growth, which, in some cases, could be because schools that already are high-performing presumably have less room for growth.
Superintendent Austin Beutner said in an interview Wednesday that the data will give district stakeholders deeper insights into the impact schools are having on student learning.
“One of the things that growth does is it takes out selection bias. And it looks at how you’re helping students on their own individual journey get better and grow. It’s a very powerful thing,” Beutner said. “I think where it’s most powerful is to look at those opportunities where growth is happening, whereby traditional measures schools might be mislabeled and misinforming the community about the opportunity that exists for students to do well.”
Growth data measure how the same group of students improve year to year on Smarter Balanced tests in math and English. The growth model used by LA Unified controls for student characteristics, such as English learner status and whether a student is homeless or in the foster care system. By measuring the progress of the same students, it also accounts for the possibility that the student composition of a school may differ from one year to the next.
Making the data public provides district stakeholders with an extra layer of data that are not included in the California School Dashboard, the state’s system for assessing school performance.
Growth data are available only to California school districts that are part of the CORE districts, which include eight of the state’s largest districts: Los Angeles, Fresno, Long Beach, Oakland, San Francisco, Santa Ana, Garden Grove and Sacramento City.
The CORE districts, which were established in 2010, compile several measures of student performance not included in the dashboard, including growth data. LA Unified on Wednesday joined Long Beach, Fresno and Oakland in sharing that data publicly.
The dashboard’s test score indicator measures student progress by calculating the difference between the current year’s scores and the previous year’s scores. It calculates the percentage of students who fail to meet, nearly meet, meet or exceed standards on the math and English language arts tests. The state is expecting to release the 2019 test scores next week.
Growth data, meanwhile, tracks the performance of the same students from one year to the next. The model used by LA Unified and other CORE districts uses a formula that predicts a student’s test score and then compares that prediction to the actual score. When calculating the predicted score, the formula considers a student’s previous test scores and whether the student is an English learner, homeless, has a disability or is low-income or in foster care. A school is considered to have high growth if its students are beating their expected scores, even if they are not meeting standards.
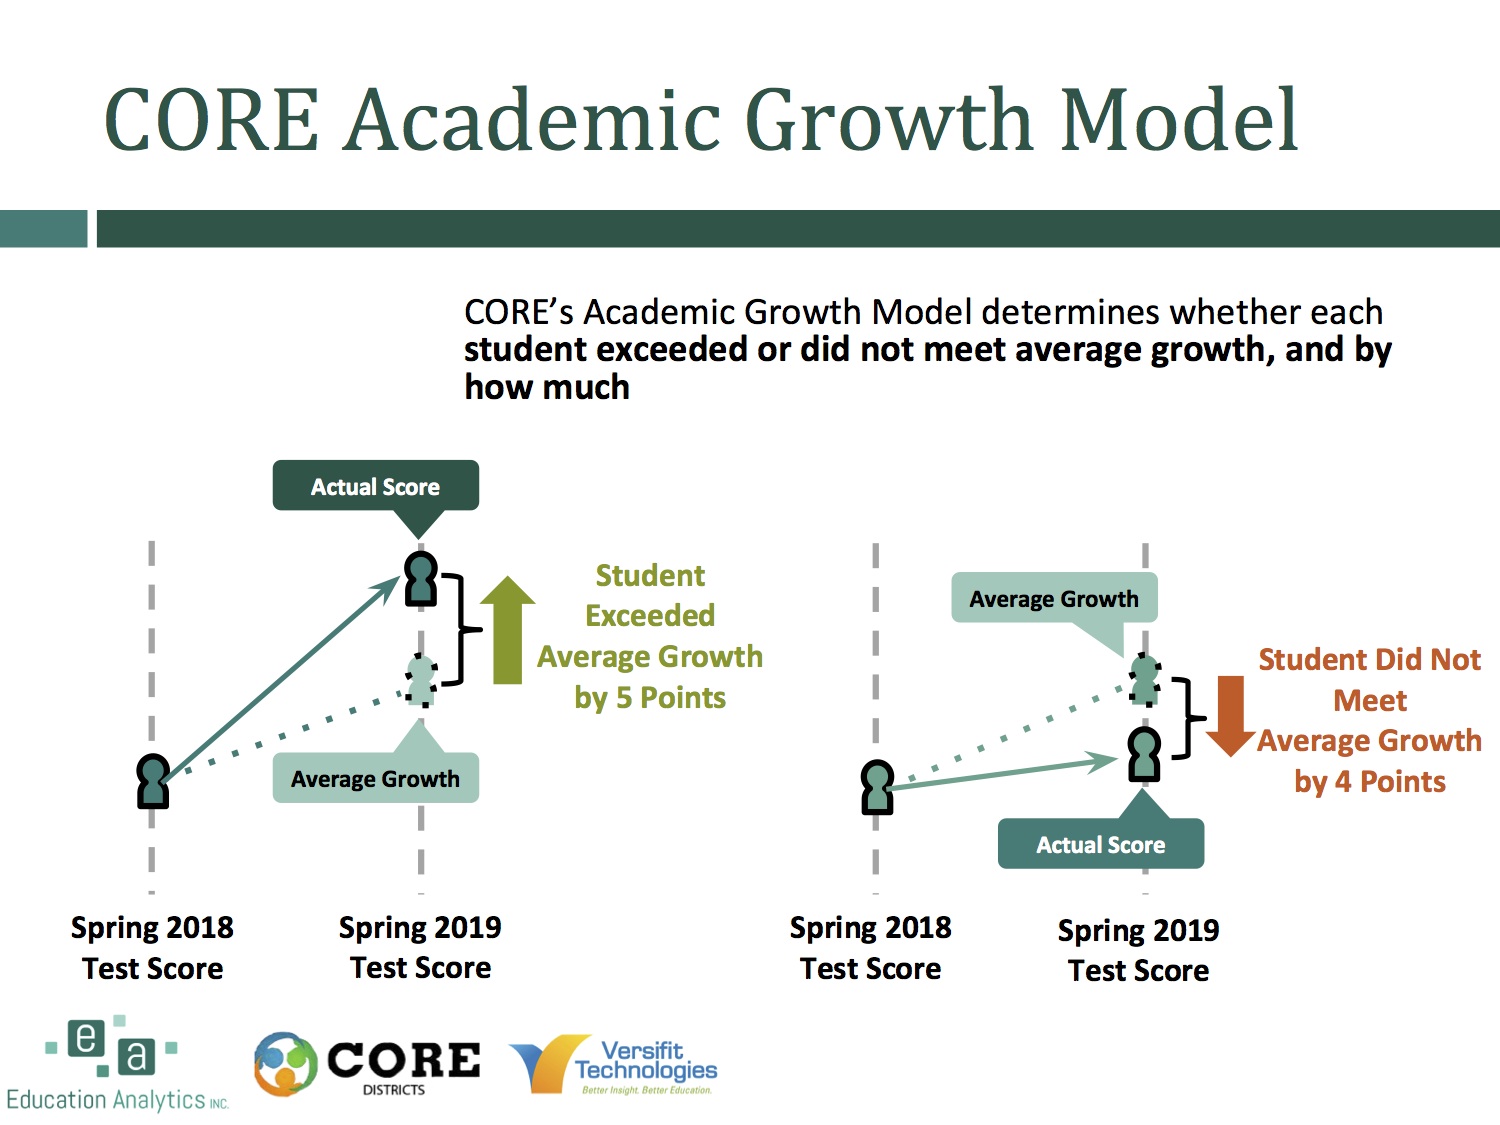
CREDIT: CORE DISTRICTS
The growth model used by CORE considers affecting student achievement and measures how much each student improves.
Growth data advocates say measuring the improvement of the same students is a better method because the students who attend a school may vary significantly from year to year.
Beutner said Wednesday that more than 40 percent of students at LA Unified students do not finish elementary school at the same school that they started in kindergarten. In some schools, that is true for up to 80 percent of students, Beutner added.
“When you’re serving a high-needs population that is quite transient due to lots of societal factors, being able to stay with a student or an appropriate cohort of students is a lot more illuminating than just looking at grade-to-grade in the same school,” he said.
The growth data released Wednesday show that certain schools in the district are showing above-average growth even though the majority of their students are not meeting standards on standardized tests.
Andres and Maria Cardenas Elementary scored 84, on a 1 to 100 scale, in growth among all students in math, even though only 21 percent of students at the school scored proficient in that subject. At Ellen Ochoa Learning Center in Southeast Los Angeles, 34 percent of students scored proficient in English and Language Arts, but the school received a growth score of 91 in the subject. Hillery T. Broadus Elementary has growth scores of 75 or better in both math and English even though almost three in four of its students were not proficient in those subjects.
At the same time, there are schools in the district that are high-achieving by traditional measures but have below-average growth. At Canyon Charter Elementary in Santa Monica, more than 90 percent of students are proficient in both math and English, but the school scored 25 or worse in growth in both subjects. There are similar trends at Warner Avenue Elementary in west Los Angeles. More than 85 percent of students at that school are proficient in both math and English, but the school has a growth score of 26 in English and 30 in math.
Beutner said the new data “adds to the overall picture” of schools in LA Unified, but added that the district shouldn’t use growth scores to make broad conclusions about any given school.
“We call it School Information+, because it’s more information about a school, but it’s not the only answer. And it doesn’t mean the existing set of information is not helpful. Of course it’s helpful. We just think we can have more information,” Beutner said.
“If you look at a measure in isolation and somehow allow that to be the only conversation you’re having, I think that isn’t the way to use information like this to help the school, help the community, help the students in the school,” he added.

A grassroots campaign recalled two members of the Orange Unified School District in an election that cost more than half a million dollars.

Legislation that would remove one of the last tests teachers are required to take to earn a credential in California passed the Senate Education Committee.

Part-time instructors, many who work for decades off the tenure track and at a lower pay rate, have been called “apprentices to nowhere.”

A bill to mandate use of the method will not advance in the Legislature this year in the face of teachers union opposition.


Comments (3)
Comments Policy
We welcome your comments. All comments are moderated for civility, relevance and other considerations. Click here for EdSource's Comments Policy.
isaac abdul haqq 4 years ago4 years ago
Charter advocates and so-called 'district partners' are going to use growth numbers to promote privatization. Beyond that, nothing is more specious, or useless, than growth data. When a district has so many schools with 0-5% proficiency in math and ELA, growth becomes a meaningless number. Rather than spending money on 'analytics,' we should be focusing on extended learning. Adding more instruction makes more sense than dividing by zero to determine 'growth.' Read More
Charter advocates and so-called ‘district partners’ are going to use growth numbers to promote privatization. Beyond that, nothing is more specious, or useless, than growth data. When a district has so many schools with 0-5% proficiency in math and ELA, growth becomes a meaningless number. Rather than spending money on ‘analytics,’ we should be focusing on extended learning. Adding more instruction makes more sense than dividing by zero to determine ‘growth.’
Manuel 4 years ago4 years ago
At this point, the outcome of this exercise is the output of a black box. How can anyone check that the algorithm does what its promoters say? So far CORE Districts has told the public "trust us as we are the experts and we know what we are doing." In my opinion, this is not enough as there is no way to confirm the "growth" claims based on SBAC data because these numbers are an … Read More
At this point, the outcome of this exercise is the output of a black box. How can anyone check that the algorithm does what its promoters say? So far CORE Districts has told the public “trust us as we are the experts and we know what we are doing.” In my opinion, this is not enough as there is no way to confirm the “growth” claims based on SBAC data because these numbers are an “average” of the individual students “growth” value. Even though the Student Performance Framework concept was scrapped, the release of the data effectively serves as a substitute. They may not call it SPF but everything else is the same as when a 5-star ranking system was in the works.
I personally don’t see how this justifies pouring resources onto school X because their “growth” is low and stagnating school Y because its “growth” is large. Can anyone point to a case study where the model has been piloted and validated?
CANDACE Hodge Phd 4 years ago4 years ago
If the rich districts have a ceiling effect, then what could the statisticians use for goal setting when 90% are proficient or exceeding proficient?