


Black teachers: How to recruit them and make them stay

Lessons in higher education: What California can learn

Keeping California public university options open

Superintendents: Well-paid and walking away

The debt to degree connection

College in prison: How earning a degree can lead to a new life

Los Angeles Unified on Wednesday is expected to become the latest California school district to publicly share data showing how its students improve year to year, a move the district expects will provide deeper insights into how individual schools are helping students progress academically.
Following in the footsteps of some of the state’s other large districts, the district will publish what’s known as academic growth data on its website as part of a new online platform called “School Information+.”
The data will provide LA Unified stakeholders with a measure of student progress that district superintendent Austin Beutner has called a better way to judge a school’s impact on student learning than relying only on what is available through the California School Dashboard.
The dashboard is the state’s system for assessing school performance on multiple indicators of student performance, including suspension rates and college and career readiness. Its test score indicator measures school progress on the Smarter Balanced tests by calculating the difference between the previous year’s test scores and the current year’s scores in each grade. It calculates student percentages at four performance standards: students who fail to meet, nearly meet, meet or exceed standards on math and English language arts tests.
Critics say the current measures are flawed because they don’t account for the possibility that the composition of a cohort of students will differ from the previous year.
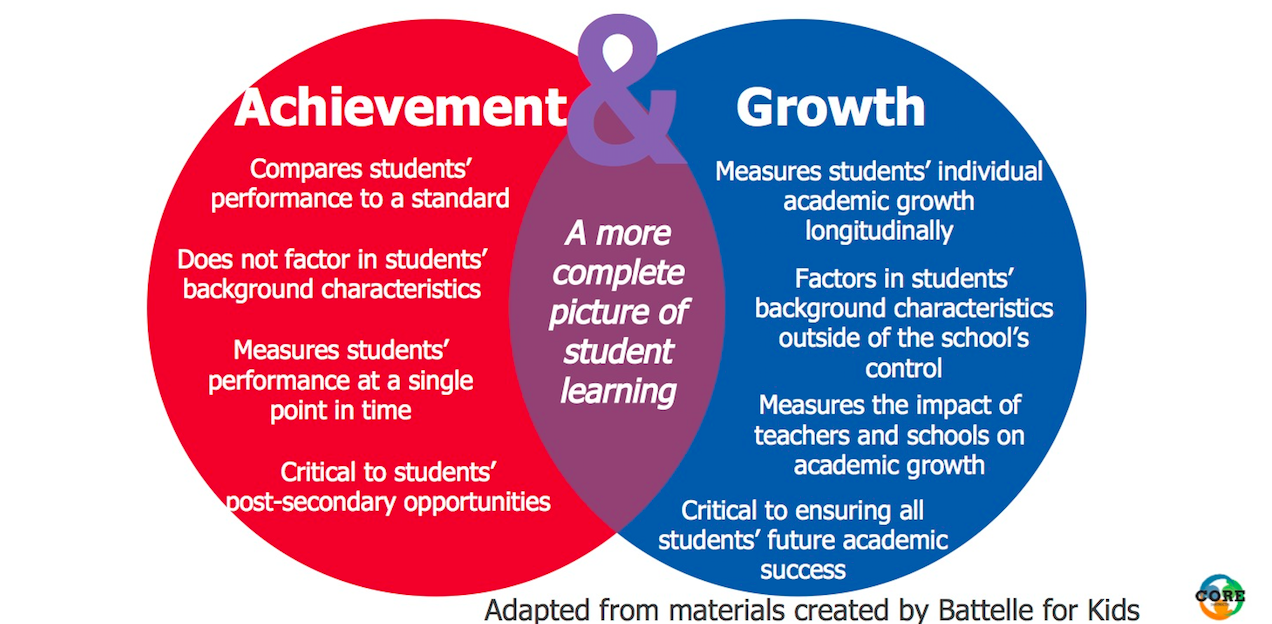
Growth data, meanwhile, measure students’ progress by tracking the same students’ scores from year to year. The result, proponents say, is more precise than measuring the proportion of students who meet standards, the equivalent of proficiency. In California, growth data is available to the state’s CORE districts, which include LA Unified, Long Beach Unified and Fresno Unified.
CREDIT: CORE DISTRICTS
The CORE Districts advocate for considering both growth measures and traditional proficiency measures when evaluating schools.
Proponents say LA Unified can use the information to identify more accurately schools that need more resources to help their students improve and that making the data public will benefit parents when deciding where to enroll their children. But skeptics warn that LA Unified shouldn’t rely too heavily on any single measure, including growth data, when judging schools.
“It’s important not to oversell what student growth data can deliver,” said Morgan Polikoff, an associate professor of education policy at the USC Rossier School of Education who has advocated for greater use of growth data. “Growth data is not going to magically solve school quality problems in LAUSD. But if you’re trying to make decisions of where to target resources or where to send your child, you at least need to have valid data about performance.”
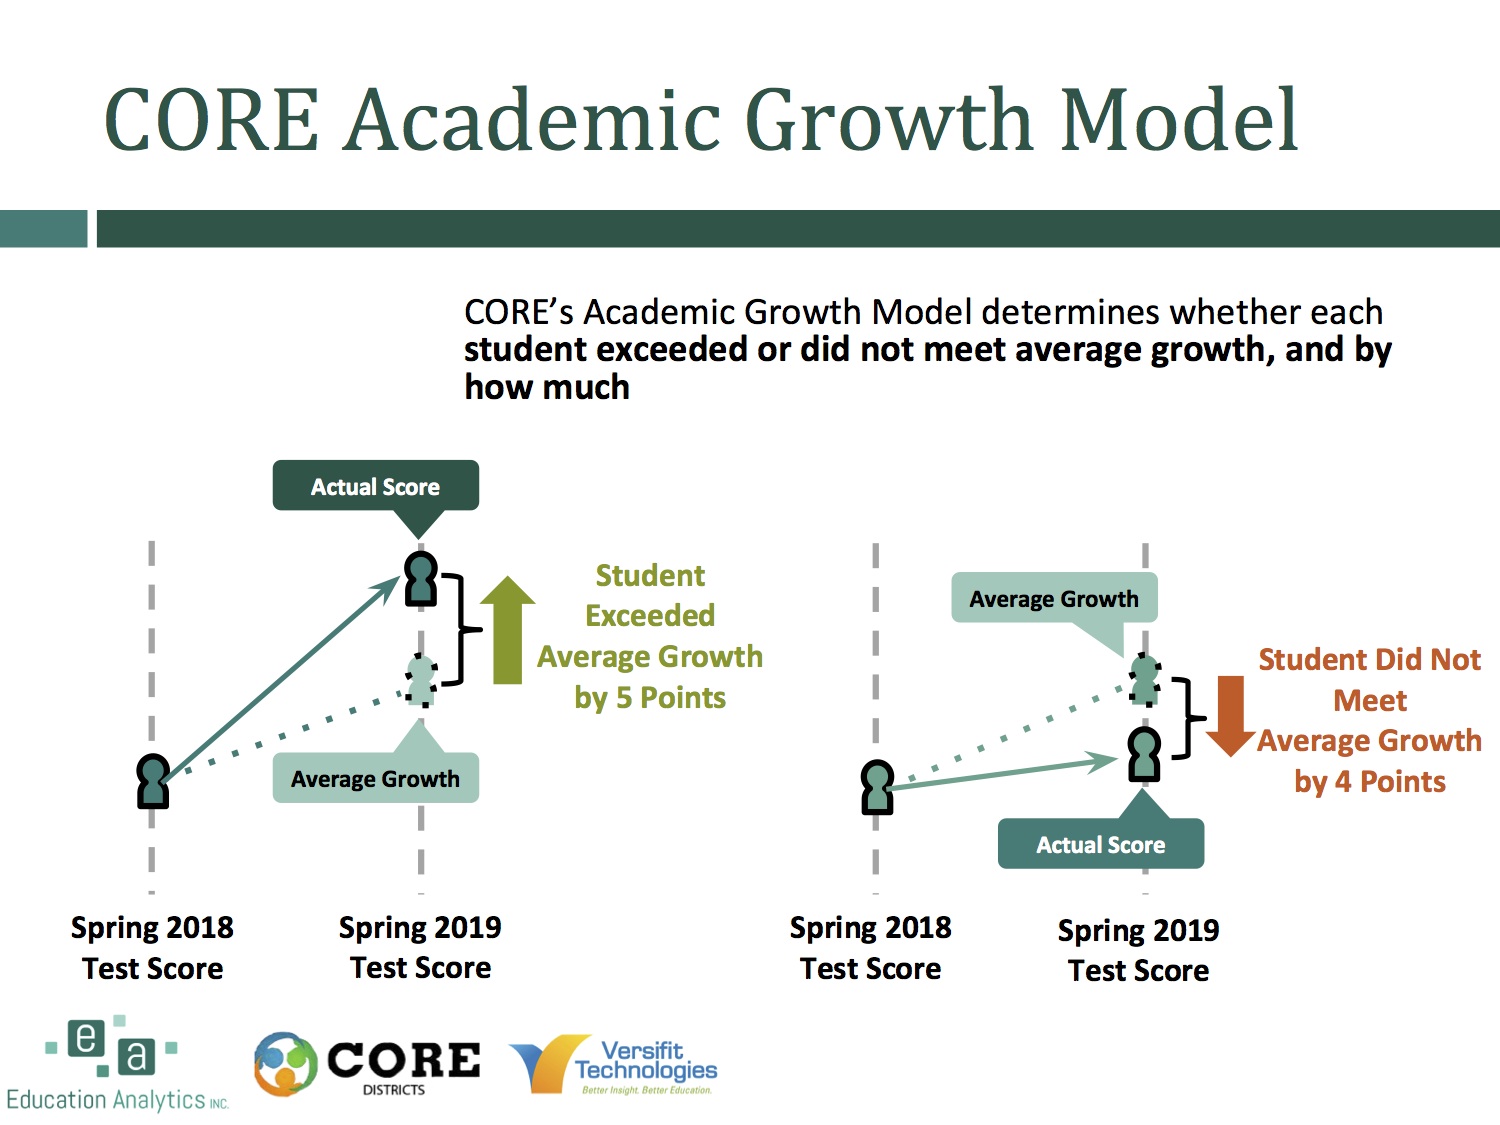
The CORE districts’ growth model uses a formula that predicts a student’s test score and then compares that to the actual score. When calculating the predicted score, the formula considers a student’s previous test scores and whether the student is an English learner, has a disability or is low-income, foster or homeless youth. A school is considered to have high growth if its students are beating their expected scores, even if they are not meeting standards.
CREDIT: CORE DISTRICTS
The CORE growth model considers factors affecting achievement and measures how students improve compared to their expected improvement.
That growth model, called a value-added model, is not the only way to calculate growth. The most common method used across the country is the student growth percentile model, which calculates how a student’s test score compares to students who received a similar score the previous year. The State Board of Education is considering including one of several growth models in a future version of the dashboard.
Established as a nonprofit organization in 2010, the CORE districts have compiled several measures of student performance beyond what’s in the state dashboard.
It’s up to each of the individual districts to determine whether to publish some or all of that data, and so far Long Beach, Fresno and Oakland have chosen to do so. Los Angeles will soon join them, after the district’s board of education voted 6-1 last month to pass board member Jackie Goldberg’s resolution that directs the district to publicly share growth data.
Beutner, the district superintendent, said in a statement last month that “providing more information to educators in our schools, as well as the families and communities we serve, is a step in the right direction.” In comments in October at the USC Rossier School of Education, he said he considers growth data “a more sophisticated way” to evaluate a school’s impact on student progress than looking only at proficiency rates.
LA Unified is the largest school district in the state, serving more than 600,000 students in almost 1,400 schools, including hundreds of magnet schools and independently operated charter schools, according to district data. In addition to growth data, the district’s “School Information+” platform will also include information about career education programs and English learner progress.
For school districts like Long Beach Unified and Oakland Unified, parents and other members of the public can view any school’s growth scores in math and English. The schools receive a color-coded score for each subject, with green indicating above average growth, orange representing average growth and red signaling below average growth.
Administrators at those districts say the data is another piece of information parents can use when they are deciding where to enroll their children.
“We want families to be able to use it as a factor when they’re thinking about what might be a good school for their child,” said Jean Wing, the executive director of Oakland Unified’s Department of Research Assessment and Data. “[Parents] take a look and say, ‘Well there aren’t that many students who are above the standard. But it looks like kids are really growing at this school. So maybe it’s worth taking a look at this school when it comes time to filling out the applications for the lottery,’” Wing added.
District leaders also say the data can help inform their decisions regarding how to allocate money and resources within the district.
Chris Steinhauser, the superintendent of Long Beach Unified, said having the data “helps me to know what I need to do to support my 84 schools.”
“It helps my rank and file at the schools — whether they be students, teachers, counselors, administrators, parents, whoever the stakeholder is — to know what we’re doing, why we’re doing it, how we’re spending our money, why we’re spending our money in a particular way,” Steinhauser said.
At Fresno Unified, growth data “fills a huge gap in our understanding of how we’re performing,” said David Jansen, executive officer of equity and access at the district.
“Primarily, it’s understanding where the outliers are. So without that growth data, there could be some key things happening at schools that goes undetected,” Jansen said. “You could have a school that on a proficiency basis looks to be a low performer, but is actually growing significantly year-to-year. And we want to know who those schools are so we can understand what they’re doing,”
But Jansen also warned that it would be a mistake for any district to rely solely on growth data to evaluate a given school and said districts should consider multiple measures when making those judgments.
Critics of growth data, such as Jesse Rothstein, a public policy professor at UC Berkeley, argue that the value-added measures are flawed because they try to assess a causal effect between schools and student learning.
“Students aren’t randomly assigned to teachers or schools,” he said. Therefore, there could be other factors at play when a student’s academic performance improves or drops year-over-year.
Goldberg, the LA Unified board member, is similarly concerned that growth data is a flawed measure and said she included it in her resolution even though she fears that the district could “abuse” the data and use it as rationale for punishing low-performing schools.
Beutner, however, has said the data will not be used as a “be all, end all” in decision-making.
“But what this information will allow us to do, my hope is, is to allow us to get on and do the work to make [schools] better,” he added during a recent board meeting.

Legislation that would remove one of the last tests teachers are required to take to earn a credential in California passed the Senate Education Committee.

Part-time instructors, many who work for decades off the tenure track and at a lower pay rate, have been called “apprentices to nowhere.”

A bill to mandate use of the method will not advance in the Legislature this year in the face of teachers union opposition.

Nearly a third of the 930 districts statewide that reported data had a higher rate of chronic absenteeism in 2022-23 than the year before.


Comments (5)
Comments Policy
We welcome your comments. All comments are moderated for civility, relevance and other considerations. Click here for EdSource's Comments Policy.
Ginger 4 years ago4 years ago
VAM and these kinds of "growth measures" are an improvement, but still a far cry from good practice. By design, Smarter Balance assessments and other measures that complied with NCLB only assess students on grade level standards and those standards are not the same from grade to grade. So, while VAM and California's new "growth model" can perform calculations based on percentiles (ranking), they are ranking individuals, schools, and districts on different things. … Read More
VAM and these kinds of “growth measures” are an improvement, but still a far cry from good practice. By design, Smarter Balance assessments and other measures that complied with NCLB only assess students on grade level standards and those standards are not the same from grade to grade. So, while VAM and California’s new “growth model” can perform calculations based on percentiles (ranking), they are ranking individuals, schools, and districts on different things. In other words, they are comparing apples to oranges.
Also, most states use cut scores at different percentile rankings for their descriptors, so using descriptors is even more problematic when determining VAM. This reader also shares concerns that many factors play into performance and the implied causal relationships in these approaches is misleading. See the work of Dr. Laurie Bassi for more insight into other factors that correlate to achievement.
Thomas S. McDonald 4 years ago4 years ago
What will happen is the the data will be manipulated by LAUSD to fit their model for improvement? Educators are no longer looked at as experts in their field, nor are they looked at as ethical, or credible. Who suffers, all the students, the funding public and society.
Dennis Higgins 4 years ago4 years ago
The CORE Districts algorithm for deciding what to expect from students at year's end considers factors such as ethnic identity and economic background. So,if you're Black, Hispanic and poor, less is expected of you than if you're White and middle-class. Jaime Escalante said (at least in the movie), "Students will rise to the level of expectation you set for them." Isn't this going in exactly the opposite direction? Read More
The CORE Districts algorithm for deciding what to expect from students at year’s end considers factors such as ethnic identity and economic background. So,if you’re Black, Hispanic and poor, less is expected of you than if you’re White and middle-class. Jaime Escalante said (at least in the movie), “Students will rise to the level of expectation you set for them.” Isn’t this going in exactly the opposite direction?
Sarah C 4 years ago4 years ago
Parents want clear, unambiguous data on how well their children are learning, and the recently published NAEP scores (the nation's "report card") really tell the whole story. For districts like Los Angeles, the results are bad. School district officials need to convince parents that they're doing a good job, and so a more flattering way to look at the data is needed. Enter CORE districts. While it is true that growth … Read More
Parents want clear, unambiguous data on how well their children are learning, and the recently published NAEP scores (the nation’s “report card”) really tell the whole story. For districts like Los Angeles, the results are bad. School district officials need to convince parents that they’re doing a good job, and so a more flattering way to look at the data is needed. Enter CORE districts. While it is true that growth data has great value for determining how well individual schools are doing, making up a “formula” for predicting what a student should should achieve and using that to compare to what a student actually achieves is just a clever way to obfuscate the truth. Most people will trust the math, but it’s a way to game the results. And that’s why legitimate growth comparisons use a straightforward percentile model. Watch. Most of the schools belonging to CORE districts are going to be showing “pretty good” growth data. Whew, and all that time we were worried.
Todd Maddison 4 years ago4 years ago
This is great news. This should be published in every district, and they should be held accountable for improvement year-over-year.