


Black teachers: How to recruit them and make them stay

Lessons in higher education: What California can learn

Keeping California public university options open

Superintendents: Well-paid and walking away

The debt to degree connection

College in prison: How earning a degree can lead to a new life
(Updated Sept. 19 to include actions by the State Board of Education.)
At its September meeting, the California State Board of Education approved a new comprehensive and dramatically different school improvement and accountability system that was three years in the making. This 10-question primer provides an overview of the system.
What’s the value in having a state school accountability system?
Using measures of student achievement and school and district performance, an accountability system can serve multiple purposes. It can:
Why is California changing its system?
For 15 years, the state used the Academic Performance Index (API) to rank schools and districts based mostly on standardized test scores. Numerous critics said this one-dimensional view of performance led schools to focus too much on test results. The Legislature and Gov. Jerry Brown in 2013 created a broader framework for accountability as part of the Local Control Funding Formula. The law says school districts must pay attention to eight priorities, including school climate, parent involvement, new state academic standards and student achievement.
The State Board of Education suspended the API in 2014 and has been working on choosing the measures, which the board calls performance indicators, of the new priorities. Congress, in passing the Every Student Succeeds Act in late 2015, also requires states to evaluate schools using multiple measures.
What will the new performance indicators measure?
There are two types. State indicators will use data that enable statewide comparisons of schools, districts and charter schools. Local indicators will measure harder to quantify priorities, including school climate and parent involvement, with data that either aren’t yet collected statewide or aren’t valid for cross-district and school comparisons.
There will initially be six state indicators:
There initially will be four local indicators:

Source: California Department of Education.
The State Board will consider adopting this metric measuring performance levels, designated by color, for high school graduation rates for every district, school and subgroups of students in the state.
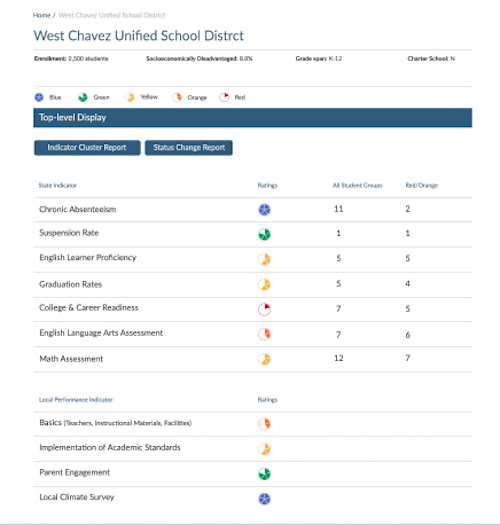
What will the new school report card look like?
Just as a student report card tells how a child is doing in each subject, the summary page of the school report card will likely display how a school or district, along with student subgroups, are doing on every state performance indicator. There will be five colors, based on how closely the school met state or local annual targets and the rate of improvement over several years (see sample above). The colors will range from red (needing substantial improvement) to blue (exceeding the state goal). Here’s a peek at a draft version. The online version will link to detailed explanations of each indicator and to guidelines and best practices for improvement.
Will I like it?
Reviews of initial drafts of the report cards were critical. Some parents and advocacy groups said that the color coding was confusing. Others said the report cards should include a summary of each school’s performance, with more emphasis on test scores, to make it easy to compare schools. The final version of the school and district report cards will be ready in early 2017. If you’re a parent leader who wants to dig deep into data, the proposed design may work for you. But if you only want a quick summary at a glance, it may not.
How will the lowest-performing schools be identified?
In order to avoid confusion from different state and federal rules for intervention, the state board wants to establish a single system. The Legislature has defined persistently low-performing districts as those in which multiple student subgroups have failed to improve in more than one priority area. The federal Every Student Succeeds Act focuses on schools, not districts, and requires identifying the lowest-performing 5 percent of schools, about 500, for comprehensive help, based primarily on test scores. The state board disagrees with this approach; it will be clear in 2017 if there’s room for compromise.
What will happen to low-performing schools?
The Legislature created a new state agency, the Collaborative for Educational Excellence, to oversee work with struggling schools and districts. Carl Cohn, its executive director, says the agency will stop top-down, “punitive” approaches under the No Child Left Behind Act and instead build partnerships with county offices of education, nonprofits and nearby districts. What will happen to schools that don’t improve, even after extensive help, isn’t clear. For now, the agency’s small staff will demonstrate how a “continuous improvement” approach will operate through pilot projects in several districts.
What’s the timeline for the new system?
Although districts and schools will receive 2015-16 performance data in late 2016, and the first report cards by February 2017, the official start date for both the state and federal accountability systems will be the 2017-18 school year. The state board says that it will continue to add and refine measures over time.
After reading my school and district report cards, what should I do?
The data on the performance indicators will show how well districts are meeting each of the state’s eight diverse priorities. The reports will highlight disparities in achievement among student groups.
In November, the California Collaborative for Educational Excellence will hold all-day workshops in eight locations. By attending one, parents, teachers, administrators and school board members will learn how they can respond to poor results on report cards through policy and funding decisions in next year’s Local Control and Accountability Plan.
Will the new system make a difference in improving student achievement?
The new accountability system is just one element among larger changes. Those changes include implementing new academic standards, expanding career and college readiness programs and, with the adoption of the Local Control Funding Formula, shifting power from Sacramento to local districts.
The new accountability system will help identify problems but will not solve them. It shouldn’t be judged by the number of districts and schools that may eventually require state intervention. Instead, look for whether the state’s nearly 1,000 districts and 1,200 charter schools are using report card data to set ambitious goals and redirecting resources to underperforming students – and whether county offices of education, which must sign off on LCAPs, are reinforcing that they do.

Legislation that would remove one of the last tests teachers are required to take to earn a credential in California passed the Senate Education Committee.

Part-time instructors, many who work for decades off the tenure track and at a lower pay rate, have been called “apprentices to nowhere.”

A bill to mandate use of the method will not advance in the Legislature this year in the face of teachers union opposition.

Nearly a third of the 930 districts statewide that reported data had a higher rate of chronic absenteeism in 2022-23 than the year before.


Comments (6)
Comments Policy
We welcome your comments. All comments are moderated for civility, relevance and other considerations. Click here for EdSource's Comments Policy.
Doug McRae 8 years ago8 years ago
The post says "State indicators, including the ones required by ESSA, use uniform reliable indicators that enable statewide comparison of schools and districts." Not mentioned in the post is that these indicators have yet to be documented as valid reliable or fair as needed for not only comparisons but also statewide accountability use. A review sent early last week to SBE, CDE, and others (including EdSource) of both Smarter Balanced and California technical data submitted to … Read More
The post says “State indicators, including the ones required by ESSA, use uniform reliable indicators that enable statewide comparison of schools and districts.” Not mentioned in the post is that these indicators have yet to be documented as valid reliable or fair as needed for not only comparisons but also statewide accountability use.
A review sent early last week to SBE, CDE, and others (including EdSource) of both Smarter Balanced and California technical data submitted to the feds in June for required “peer reviews” showed substandard validity reliability and fairness for the 2015 Smarter Balanced ELA and Math tests. For reliability, the submitted data for low wealth students , English Learners, and Students with Disabilities were considerably lower than acceptable especially for Math tests at the higher grade levels, and the Smarter Balanced submission acknowledged its information “revealed some gaps in item coverage at the low end of the performance spectrum,” the likely cause for the substandard reliability information. This review is public information, and the transmittal email as well as 2-pages of highlights and 8-pages of detailed observations drawn from the thousands of pages of technical material submitted by SBAC and CA two months ago are available for interested readers.
On another testing issue, for months the CDE has been promising release of 2016 Smarter Balanced test results “mid-August.” Last week, the CDE changed to the expectation to “late August.” Is there an explanation for the delay? The vendor (ETS) contract calls for availability of school and district aggregate data by August 8 for internal CDE and LEA quality control purposes, anticipating public release of aggregate results by August 15. Did ETS miss their contractual deadline again this year, as they did last year resulting in a financial penalty of $3.1 million? Or does CDE have the data from ETS but is delaying public release for unknown reasons?
Replies
Don 8 years ago8 years ago
Hello Doug, could you link the review you referenced concerning validity reliability?
Below is a link to a piece from last year on SBAC reliability from a less technical point of view. It touches on many of the obvious SBAC shortcomings. It is probably of less interest to you as an insider, but I think the average reader might appreciate it.
https://dianeravitch.net/2015/07/10/researcher-sbac-test-is-not-valid-or-reliable-or-fair/
https://dianeravitch.net/2015/07/10/researcher-sbac-test-is-not-valid-or-reliable-or-fair/
Doug McRae 8 years ago8 years ago
https://www.documentcloud.org/documents/3022022-DougMcRae2-sbepeerreviewcommentsAug2016.html should get you to the review I referenced. The document includes 8+ pages of detailed observations followed by 2 pages of highlights (bottom page 9 to top page 11) and finally less than 1 page of cover email summary material on page 11. Be happy to answer any questions on this CA and SBAC peer review submission analysis. [Thanx to JF for putting the material in the document cloud.]
Don 8 years ago8 years ago
Yes, thanks to you both for making this info available. I suppose I should be disturbed to know that the test is less than reliable, but then I'm reminded of the old reference to gambling in Casablanca. I would add that, while I have a narrower district-oriented perspective as a parent and observer of SFUSD, the School Improvement Grant experience illustrated how low test participation rates can skew data to the upside. ...something not much discussed … Read More
Yes, thanks to you both for making this info available.
I suppose I should be disturbed to know that the test is less than reliable, but then I’m reminded of the old reference to gambling in Casablanca.
I would add that, while I have a narrower district-oriented perspective as a parent and observer of SFUSD, the School Improvement Grant experience illustrated how low test participation rates can skew data to the upside. …something not much discussed in the context of a myriad of other deficiencies. I wonder whether ADA is ever matched against participation rates?
I read the info from Doug and I have to say I made the right decision to opt out. In the final analysis, literally speaking, it is up to the consortium and its partners/vendors to demonstrate validity reliability. It is amazing how many teachers don’t even bother to question the integrity of the test results. Like it was handed down from God.
on another note – I was wondering why there seemed to be a total blackout on a new release date for the spring 16 administration. I guess the test wasn’t as shovel ready as we thought…
Again, thanks so much for the info.
-Don
Fred Jones 8 years ago8 years ago
Excellent overall summary, John! Lots of moving parts and details for SBE to work through. I also wonder whether the Legislature will start throwing their weight around in the coming year, as SBE rushes to put all of this together (and whether the Governor will acquiesce to any such further, statutory micromanagement in his waning days in office). It's ironic that when this Governor came back to the corner office for his 3rd term, … Read More
Excellent overall summary, John! Lots of moving parts and details for SBE to work through. I also wonder whether the Legislature will start throwing their weight around in the coming year, as SBE rushes to put all of this together (and whether the Governor will acquiesce to any such further, statutory micromanagement in his waning days in office).
It’s ironic that when this Governor came back to the corner office for his 3rd term, he regularly vetoed education related bills, calling for a respite from “the siren song of education reform” … and now, under his leadership, we’ve seen the most dramatic reforms in how we found and hold accountable our schools.
Replies
John Fensterwald 8 years ago8 years ago
Thanks, Fred. There is a bill to watch, AB 2548, by Shirley Weber, that does assert the Legislature's role in the process by making sure that the State Board follows through the the accountability commitments laid out in the Local Control Funding Formula. It also commits the state to implement the Every Student Succeeds Act, which, given the State Board's disagreements with some of the proposed ESSA regs, could lead Brown to veto it. After … Read More
Thanks, Fred. There is a bill to watch, AB 2548, by Shirley Weber, that does assert the Legislature’s role in the process by making sure that the State Board follows through the the accountability commitments laid out in the Local Control Funding Formula. It also commits the state to implement the Every Student Succeeds Act, which, given the State Board’s disagreements with some of the proposed ESSA regs, could lead Brown to veto it. After a decade under No Child Left Behind, Brown and the State Board appear determined to do school reform their way.