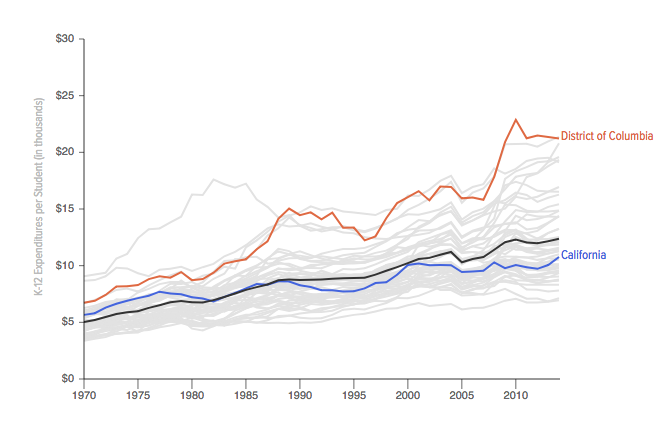
This project takes a historical look, through interactive charts for all 50 states plus the District of Columbia, at how the economic and social conditions have changed over time, and how those changes have affected states’ investment in education and student achievement. The focus is on how California has changed compared with other states.
Questions we sought to answer include:
To get more reports like this one, click here to sign up for EdSource’s no-cost daily email on latest developments in education.
