

Detailed data on restraint and seclusion in California special education classrooms is limited.
State law used to require school districts to report the use of these measures to regional associations known as Special Education Local Plan Areas. However, as of July 1, 2013, school districts were no longer required to do so, and SELPAs were no longer required to share that information with the California Department of Education. The 2011-12 school year is the last period for which there are data on the number of these reported incidents.
Although data collection was to have begun in 1990, it wasn’t until the 2005-06 school year that school districts started to report this data to the state, largely due to the state pushing SELPAs to comply with the law.
There is also no centralized database for the reported incidents. However, EdSource analyzed 696 reports from six SELPAs (Mid-Alameda, North Santa Cruz, Poway, Riverside, Tahoe-Alpine and Tri-Cities) to search for patterns in the data; the analysis found there were no standardized forms across schools and SELPAs for documenting behavioral emergency incidents and there were inconsistencies in what information was documented in the reports.
Through the analysis EdSource was also able to glean insight on what events led to a behavioral emergency incident, and what kinds of emergency interventions school staff members used.
1. Better reporting, or more incidents?
Download: PDF file || Image file || Data
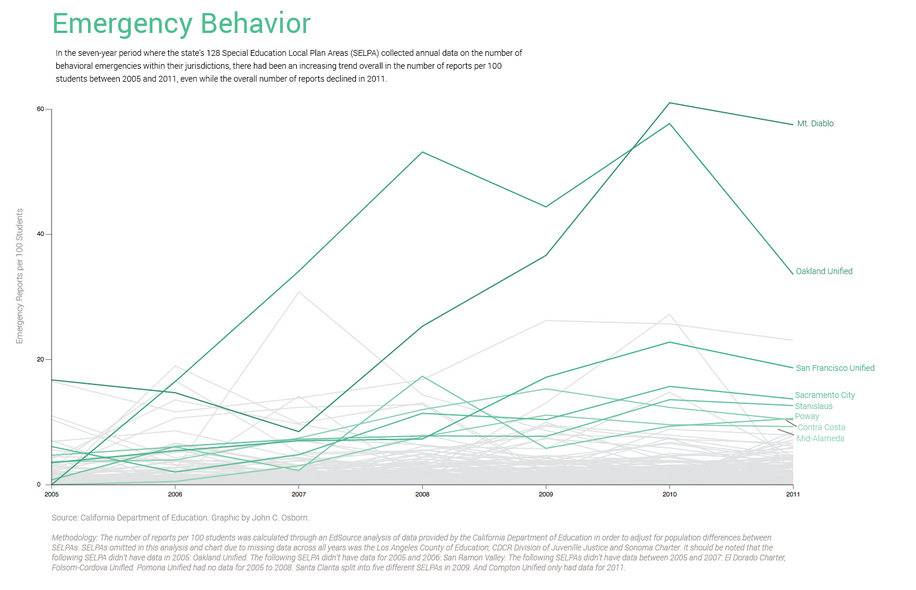
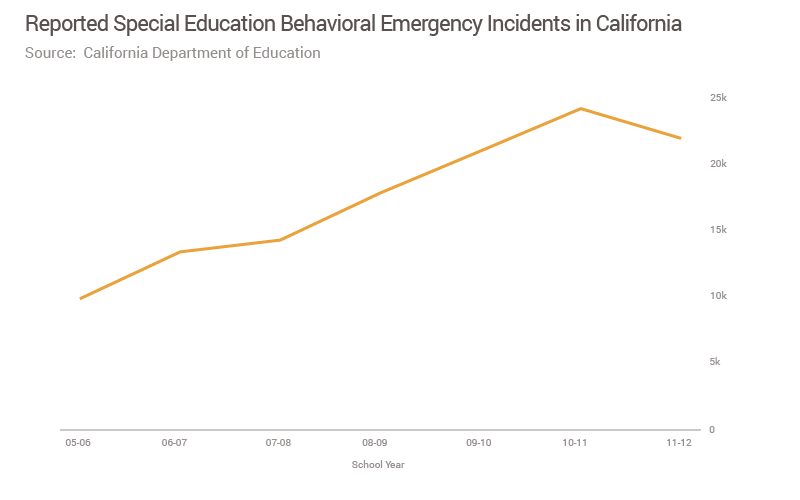
Behavioral emergency incident reports are filed when a student has an episode requiring staff to use emergency seclusion or restraint techniques. The number of behavioral emergency incidents reported by the schools in the state’s SELPAs increased between the 2005-06 and 2011-12 school years.
Although the data peaked during the 2010-11 school year and declined by 9 percent the following school year, it’s impossible to know whether this was an anomaly or it was the start of a downward trend regarding reported emergency incidents, as SELPAs no longer are required to report these incidents to the California Department of Education.
It’s also difficult to know whether the increase in reported incidents between 2005-06 and 2010-11 was the result of schools improving their reporting, the occurrence of more emergency incidents, or a combination of both.
2. Majority of SELPAs have few reports of incidents
Download: Image file || Data
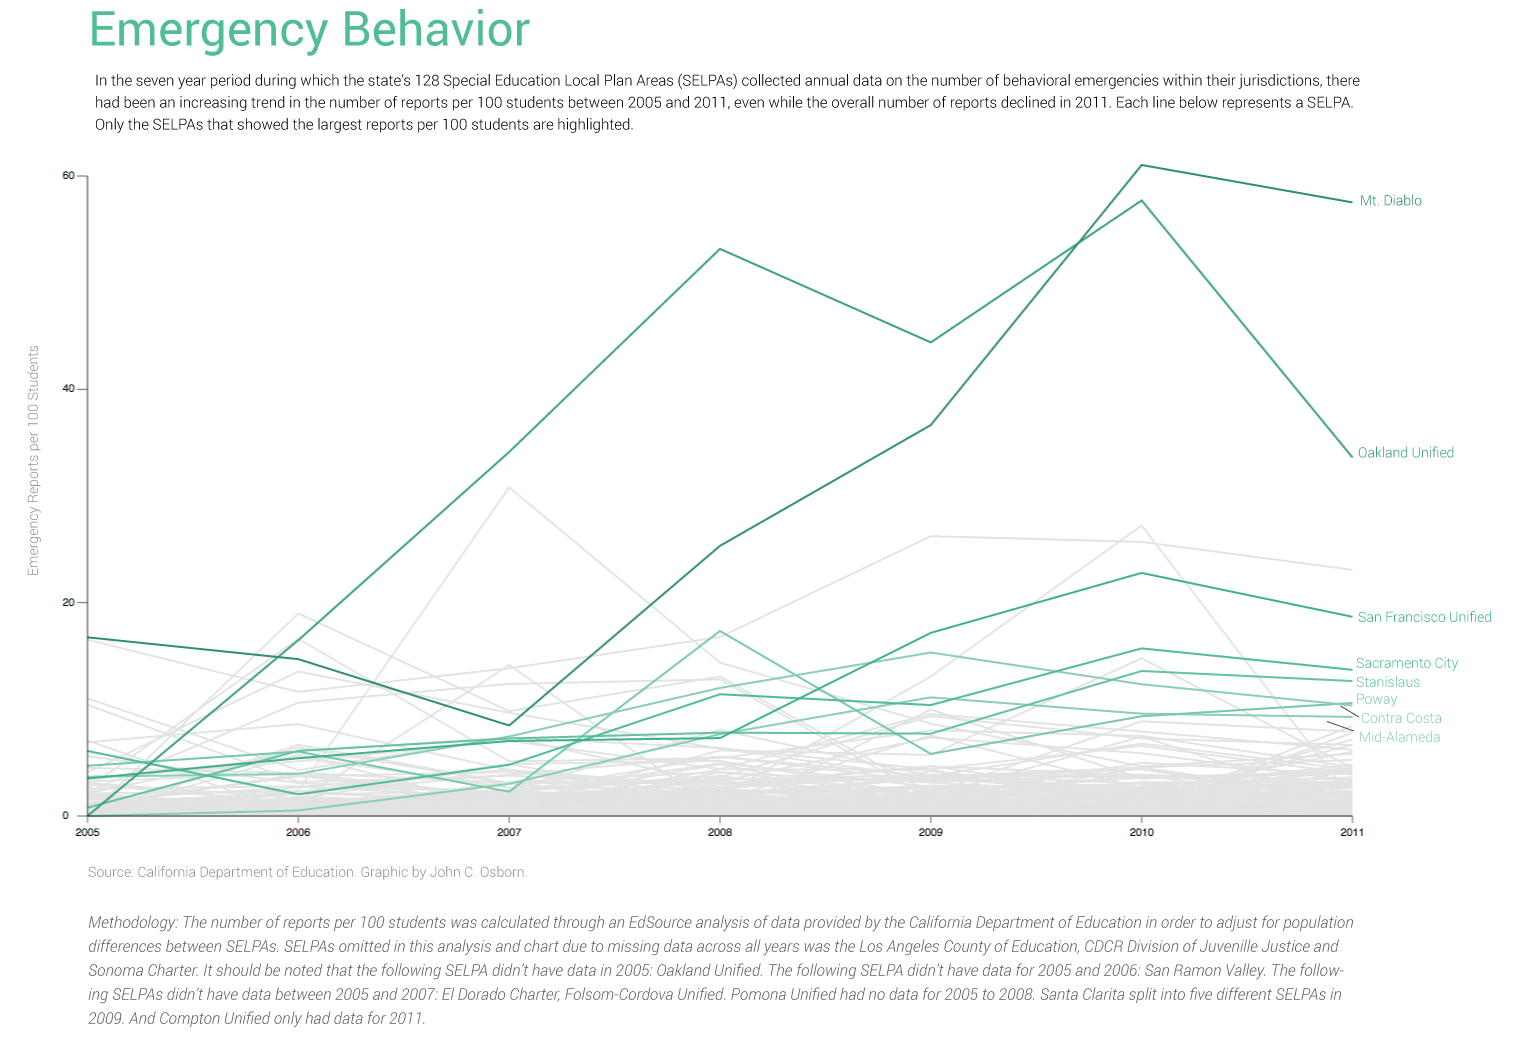
By the 2011-12 school year, half of the 126 SELPAs with data to report had less than two reported incidents per 100 students. In the graphic above, these are reflected in the gray lines mostly at the bottom of the chart. A quarter had more than four reported incidents per 100 students.
As mentioned before, it’s unclear why some SELPAs have greater or fewer reports. One assumption is there were fewer emergency incidents at that SELPA. But according to a 2007 report by Protection and Advocacy Inc. (now Disability Rights California) titled “Restraint and Seclusion in California: A Failing Grade,” the majority of SELPAs at that time had done a poor job of ensuring that schools reported these incidents.
3. Bay Area SELPAs among highest reported incidents, Southern California SELPAs among lowest
Download: Image file
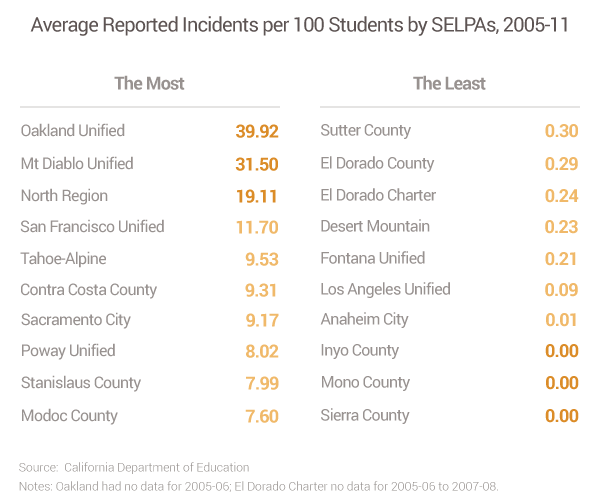
Of the SELPAs ranked in the Top 10 in the number of reported incidents per 100 students between the 2005-06 and 2011-12 school years, half are located in the Bay Area. In contrast, six of the 10 SELPAs with the lowest number of reported incidents per 100 students in that same period are located in Southern California.
The state’s largest SELPA – Los Angeles Unified – had among the fewest reported emergency incidents per 100 students. In the 2011-12 school year the Santa Clara Area I SELPA had roughly the same number of reported incidents as Los Angeles Unified did, despite LAUSD being about 30 times the size of Santa Clara Area I.
What is unclear is whether the Los Angeles Unified SELPA had 103 emergency incidents among its 82,257 students in that SELPA, or whether only 103 incidents were reported and others went unreported.
4. Nonpublic schools have more reported incidents

Download: PDF file || Image file || Data
Nonpublic schools, which are private special education schools that receive public funds from school districts, have reported a greater proportion of behavioral emergency incidents consistently between the 2009-10 and 2011-12 school years. There were no data for prior years. These schools consist entirely of special education students, catering to the most problematic students, which could account for more incidents. They could also be more diligent about reporting every incident
5. What led to an emergency incident?
Download: PDF file || Image file || Data
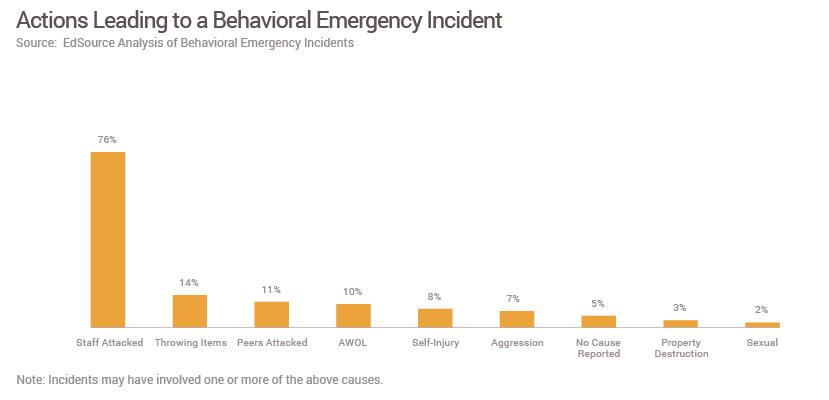
After reviewing 696 behavioral emergency reports from the 2011-12 school year from six SELPAs, an EdSource analysis was able to identify a number of events that led to an incident for 95 percent of those reports. The vast majority of incidents involved a student attacking a staff member, such as biting, punching, or pulling hair.
In addition to assaults on staff members, the events that led to an incident included students attempting to run away, students attacking a peer, or injury to self (e.g. banging head against wall).
This is a breakdown of all the definitions in the above chart:
Staff Attacked: Student attacked a staff member.
Throwing Items: Student was throwing items either at another person or in general.
Peer Attacked: Student attacked another student.
AWOL: Student either tried to run away, usually off campus, or successfully did so.
Self-Injury: Student was harming themselves.
Aggression: Student acted in an agressive manner, but did not attack another person or self.
No Reported Cause: There was no cause identified in the report or in the narrative.
Property Destruction: Student was damaging property.
Sexual: Student was speaking or acting in a sexually inappropriate way.
6. How did staff handle the situation?
Download: PDF file || Image file || Data
According to state law, seclusion and restraint are allowed when they are the only way to control a student’s behavior and there is a “clear and present danger” of physical harm.
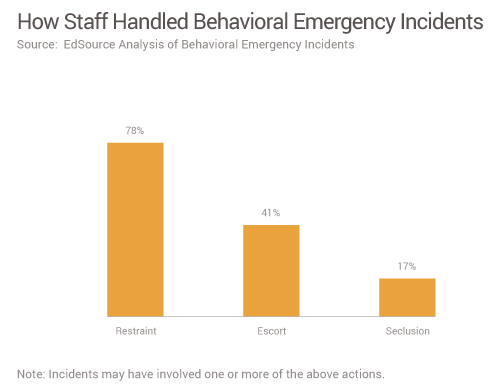
In our analysis, we identified three types of staff interventions that required an emergency response:
Restraint: Staff used physical techniques to prevent a student from moving or taking action. There are a number of different types of restraints (see below).
Escort: Staff physically escorted a student to another area, such as a seclusion room or calm area, to help de-escalate a situation or prevent other people from being harmed by a student.
Seclusion: Staff held a student in a special room until the student calmed down. The configuration of the room depended on the school or facility.
7. What types of restraint were used most?
Download: PDF file || Image file || Data
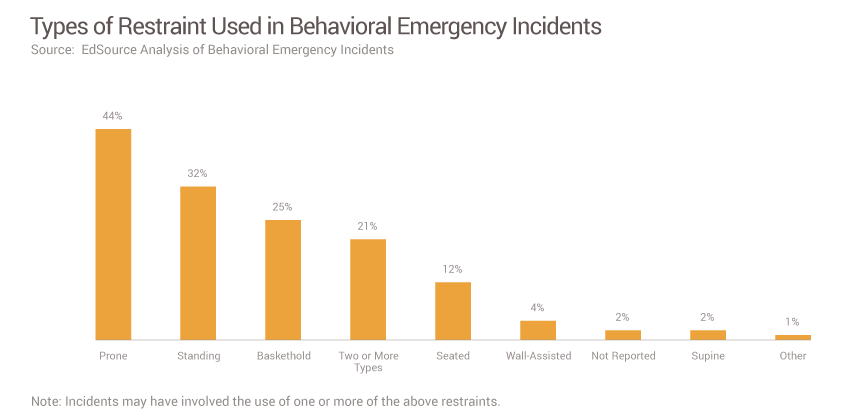
In incidents in which staff restrained a student, 239 – close to half – involved the use of a prone restraint. Although not official policy, a 2012 report from the U.S. Department of Education stated that prone restraints “should never be used” in special education because of the risk of serious injury or death.
In the reports reviewed by EdSource, staff members often needed to restrain a student multiple times over the course of an incident. In 1 in 5 of those, more than one type of restraint was used.
The duration of restraints was also reviewed when that data was available. In 479 incidents where only restraint was used on a student, the average duration in which a student was restrained was 7 minutes; the maximum duration was 71 minutes.
This doesn’t necessarily mean a student was held for 7 minutes or 71 minutes continuously; it reflects the total amount of time in which restraint was used during an incident.
The types of restraint we identified in the reports:
Prone: Staff laid a student facedown while holding the student’s limbs.
Basket Hold: Staff grabbed the wrists of a student and positioned the student’s arms in a way similar to what a straitjacket does. These types of restraints can be implemented when the student is lying down, sitting or standing.
Standing: The reports were unclear whether these were standing basket hold restraints or other forms of restraint where the students were standing.
Seated: The reports were unclear whether these were seated basket hold restraints or some other type of seated restraint.
Wall-Assisted: Staff used a wall to help provide leverage in a restraint hold.
Not Reported: Report did not specify the type of restraint used.
Supine: The reverse of a prone restraint, where a student was lying face up with staff holding the student’s limbs.
Other: Several restraints were identified in the reports that didn’t provide enough detail to be placed in one of the above categories.
Wendi Jonassen, an Oakland-based freelance journalist, assisted in researching the behavioral emergency reports.
To get more reports like this one, click here to sign up for EdSource’s no-cost daily email on latest developments in education.