


Black teachers: How to recruit them and make them stay

Lessons in higher education: What California can learn

Keeping California public university options open

Superintendents: Well-paid and walking away

The debt to degree connection

College in prison: How earning a degree can lead to a new life
Rick Miller
As surreal as it was, the recent confirmation hearing for Betsy DeVos, the likely next secretary of education, raised a critical policy question even here in California – and I’m not talking about grizzly bear protection.
While I think we can all agree that she did not have a sufficient answer to Sen. Al Franken’s question regarding the choice between using student proficiency or academic growth to gauge school progress, I would actually argue the senator’s question implied a false choice.
This “choice” is an issue the CORE Districts debated at length in creating our shared school improvement and accountability system – and we concluded the answer was both.
To measure achievement in the CORE Districts, we chose to take into account both the number of students meeting standards and how much academic growth students are making each year. We call this the “Power of Two.”
In the CORE Districts’ data system, educators have access to test score measurements that are clear and easy-to-understand, and are uniquely helpful by highlighting how schools are improving student learning. School reports – highlighting academic growth as well as academic performance and other school progress measures – are available online.
With two consecutive years of test results available to compare locally, the “Power of Two” is taking hold within the CORE Districts’ data network. At the district and county level, data are being shared with local educators to raise awareness about the range of academic growth within each system. The data are reassuring and motivating to educators working hard to change trajectories for the large number of traditionally underserved students in California’s public schools. This approach also provides a more finely-tuned road map for school and systemwide improvement.
Our data network and our learning continues to expand in large part because this growth model is so powerful. Test results no longer stand alone, and we can now also examine how students are improving from year-to-year.
In our data system, state and locally-driven measures of school progress are connected and can better inform what we know about student achievement. Since we opened our data network to all educational agencies at the beginning of this school year, it has doubled in size, with 37 school districts, three county offices of education and two charter management organizations now sharing data.
In order to evaluate academic growth fairly, we worked with our statistical research partners to ensure our data system accounted for differences among individual students. At its core, a growth model is intended to gauge whether individual students grew more or less than what could be expected from students like them – what we call “like peers.”
But what is a “like peer”? Determining that is the heart and soul of a growth model, and where the difficult policy decisions lie. After much debate, the CORE Districts decided to take into account students’ prior test history and their status as economically disadvantaged, disabled, English learner, homeless or in foster care.
Not only are these adjustments made at the student level, but our growth model also adjusts for concentration of these characteristics within the school.
As a result of these decisions, schools with high concentrations of youth in poverty have an equal chance of being viewed as “high-impact” schools – those having a major impact on students’ learning outcomes – as those with mostly well-to-do students.
If we had just considered prior test scores and none of the other attributes, a high-poverty school would have had almost no chance of showing that they had considerable impact on learning. Conversely, a low-poverty school would almost assuredly not be viewed as a “high impact” school as measured by learning outcomes.
Our growth model is helping us pinpoint where outcomes are improving for specific groups of students so we can apply what we are learning to better support all of California’s 6.2 million students.
Yet this decision didn’t come easily for the CORE superintendents; they wrestled with these policy choices. Especially challenging was acknowledging schools for the academic growth their students were demonstrating, even when few students “met standards” as measured by their scores on the Smarter Balanced assessments.
This was a particularly difficult choice in light of the pervasive achievement gap, especially in math for African American and Hispanic/Latino students across the CORE Districts. But in the end, we felt that because we were using the “Power of Two” and would always highlight overall proficiency as well as growth, it was important to include exceptional progress as measured by improvements in learning outcomes even if a school and its students still had a long, long way to go as measured simply by the number of students who “met the standards.”
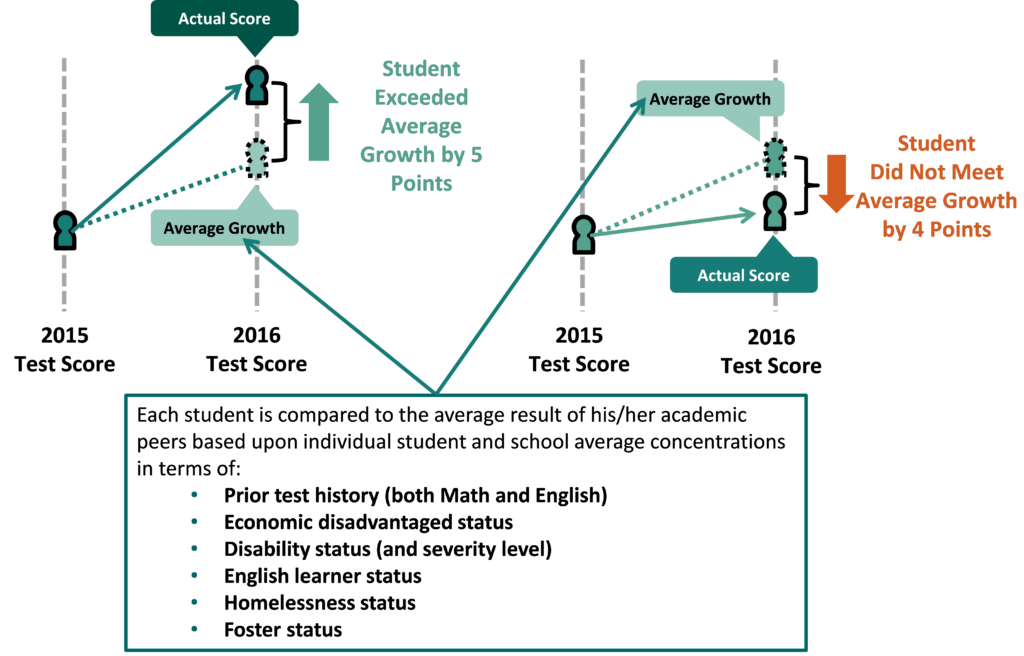
CREDIT: CORE Districts
The growth model takes into consideration factors that affect student achievement and measures how much the students improved, not just their test scores.
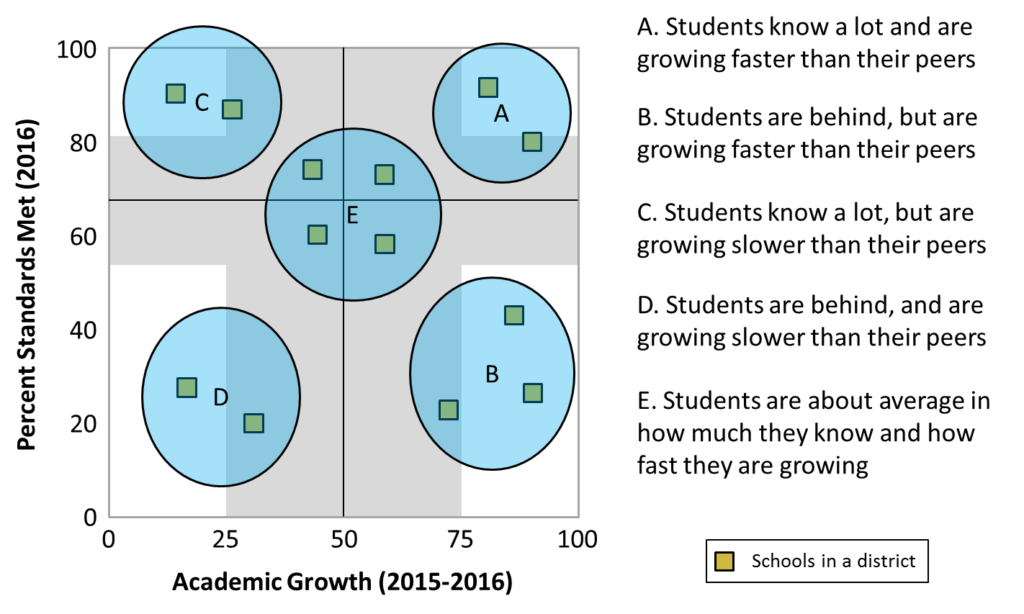
CREDIT: CORE Districts
The “Power of Two” helps identify schools where students are learning significantly faster or slower than their academic peers.
Our growth model highlights the impact of educators at each school in a different way than scores alone. The “Power of Two” helps us identify schools where students are learning significantly faster or slower than their academic peers, and it provides key information about which schools need the greatest support and intervention.
It is encouraging that the California State Board of Education is discussing adding a student-level growth measure to California’s soon-to-be-released school accountability dashboard. We strongly believe “the Power of Two” helps capture the true nature of our schools’ academic achievement, and it furthers California’s overall educational mission of continuous improvement for schools and students. This work is the closest we have to a guarantee that we continue to view all work through the lens of equity and access for all students in California public schools.
Through our partnership with Policy Analysis for California Education (PACE), we will also continue to share our quantitative and qualitative findings with state and federal decision makers to inform policy. Most importantly, our data network is now open to all local educational agencies to provide a finely-tuned look at student-level academic growth and a more complete picture of school progress. And if ever faced with a similar question at a congressional hearing, we’ll know to say: “Both!”
•••
Rick Miller is the executive director of the CORE Districts, a nonprofit organization that seeks to improve student achievement by fostering collaboration and learning among its members, which include some of California’s largest districts.
EdSource welcomes guest commentaries representing diverse points of view. If you would like to submit a commentary, please review our commentary guidelines, and contact us.

Legislation that would remove one of the last tests teachers are required to take to earn a credential in California passed the Senate Education Committee.

Part-time instructors, many who work for decades off the tenure track and at a lower pay rate, have been called “apprentices to nowhere.”

A bill to mandate use of the method will not advance in the Legislature this year in the face of teachers union opposition.

Nearly a third of the 930 districts statewide that reported data had a higher rate of chronic absenteeism in 2022-23 than the year before.


Comments (1)
Comments Policy
We welcome your comments. All comments are moderated for civility, relevance and other considerations. Click here for EdSource's Comments Policy.
Doug McRae 7 years ago7 years ago
Rick does a good job describing the policy choices involved for implementing an accountability system featuring more than one "target" measure. Using two target measures does increase the complexity of the system, perhaps by a factor of four, and makes it more difficult to explain to school trenches and the public. But, over time, it should provide better data for both administrative and policy decisions at the local level. However, the devils are in the details … Read More
Rick does a good job describing the policy choices involved for implementing an accountability system featuring more than one “target” measure. Using two target measures does increase the complexity of the system, perhaps by a factor of four, and makes it more difficult to explain to school trenches and the public. But, over time, it should provide better data for both administrative and policy decisions at the local level.
However, the devils are in the details for a system focusing on both Status (or proficiency) and Change (or growth). Primary among the devilish detail is the choice of “cut scores” for both status and change measures, the thresholds that separate when data should be labeled exemplary, good, on-par, not-so-good, or requiring immediate attention. Rick’s post did not get to this level of detail, but undoubtedly the CORE designers spent many hours deliberating and debating how to set threshold scores for their system.
The California state accountability system now under development by the California Department of Education and the State Board of Education follows the 2-measure approach described by Rick, and the threshold scores for both Status and Change for the main statewide test scores were approved at the January SBE meeting several weeks ago. Unfortunately, the board did not take into account either known expectations for increases in Status scores over time or known variability for Change scores for schools and districts of different sizes. Failure to include these known factors will undoubtedly erode the credibility of the new state accountability system over time.
Building a strong accountability system is a complex task, one that requires much reflection, discussion, debate, and forward thinking. CORE and the state are on the right track by focusing on both Status and Change measures, but rushing to judgment on details like threshold scores increases the odds for derailment before any new system will be able to stand the test of time.