


United States 15-year-olds have continued to tread water while youths in a number of nations have glided past them in the latest results of PISA, an international test in math, science and reading given in 65 nations.
The scores led to a predictable finger-pointing from advocates and detractors of current education reforms.
In math, the United States scored below 29 nations and education systems in 2012 on the Program for International Student Assessment – dropping from 23rd in 2009, when the test was given last; the latest average score posted by the U.S. was higher than 26 nations and not measurably different than 9. Poland, Vietnam, Austria, Ireland, the United Kingdom, Latvia and Luxembourg passed the United States for the first time.

The U.S. score of 497, on a scale of 1,000, in science, was about average for the 65 PISA nations but measurably behind 26 nations. Note that scores of Massachusetts and Connecticut (see lower right) were significantly higher than average.
In science, the United States lagged behind 22 nations – falling from 18th in 2009; scores were higher than 29 nations and about the same as 13.
And in reading, its best area, the United States was behind 19 nations – a fall from 9th in 2009; it was above 34, and about the same as 11.
Compared with the 34 industrialized nations in the Organization for Economic Cooperation and Development (OECD), which administered the test, American teens were below average in math and about average in reading and science. U.S. scores on PISA have stagnated over the past decade in all three areas. Russia, which had been behind the United States, has caught up, while Vietnam, Germany and Poland are among nations that have made significant progress.
Three states – Massachusetts, Connecticut and Florida – paid to have their scores broken out. Had Massachusetts, the highest-performing U.S. state on the National Assessment of Educational Progress – been a nation, it would have been among the highest achievers in PISA in reading. It scored ahead of the average scores of the industrialized nations in all three subjects; Florida scored about the U.S. average. Connecticut was not far behind Massachusetts in reading.
Shanghai students led the world in all three subjects, followed by Hong Kong. Japan, Singapore and Korea were also top fliers. Education experts have pointed out that Shanghai’s students are not representative of China; Tom Loveless, a senior fellow at the Brookings Institute, asserted that it has “systems in place to make sure that students who may perform poorly are not allowed into public schools.” Other provinces in China also administered the test, but the results weren’t reported.
PISA reported scores in six levels of proficiency, with level 1 being the lowest, showing minimum skills, and level 6 the highest. In Shanghai, 55 percent of students achieved levels 5 or 6 in math, compared with only 9 percent in the United States and 13 percent for the 34 OECD nations.
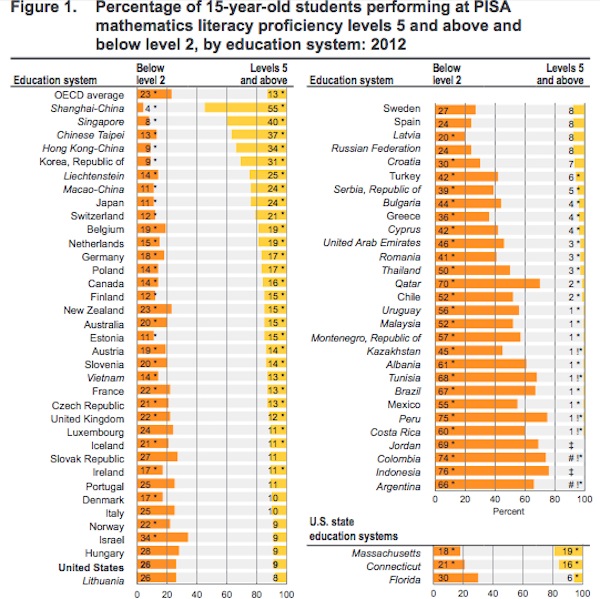
PISA broke scores down into six levels of proficiency, with level 6 the hardest to achieve. This chart shows the breakdown by percentages of students in level 2 or below (yellow) and level 5 or above (orange). Massachusetts, Connecticut and Florida are in the lower right. Source: PISA.
Massachusetts had nearly one in five students at levels 5 or 6 in math; Florida had only 6 percent. In reading literacy, 16 percent of Massachusetts students were at levels 5 and 6 – twice the U.S. and OECD average. Shanghai topped the chart with 25 percent.
The PISA was given to 510,000 randomly selected students across the world, including 6,100 in the United States; it is administered every three years.
Even before the results were released on Tuesday, recriminations and criticisms began.
Richard Rothstein, a researcher with the Economic Policy Institute, and Stanford University education professor Martin Carnoy, both critics of international comparisons, wrote that more poor students in the United States take the exam than in other nations, skewing the results, and that “threats to the nation’s future prosperity come much less from flaws in our education system” than from the nation’s failure to deal with unemployment, poverty and inequality.
American Federation of Teachers President Randi Weingarten, in a statement, said that the PISA scores proved that “a decade of top-down, test-based schooling created by No Child Left Behind and Race to the Top — focused on hyper-testing students, sanctioning teachers and closing schools — has failed to improve the quality of American public education.”
But Eric Hanushek, a research fellow with the Hoover Institution at Stanford, called for doubling down on what Weingarten excoriated. “What the PISA results show is the dire need to entertain more radical changes in our stagnant schools: more choice, more performance pay, and more local decision-making. Each of these will help America’s kids, however, only if there is also a good system of standardized testing that identifies failing schools and holds them accountable,” he said in a statement.
Noting that Vietnam made significant strides even though 79 percent of children live in poverty, U.S. Secretary of Education Arne Duncan said Tuesday that “our diversity fails to explain why U.S. students lag behind their peers in high-performing nations.”
While stating that the United States must continue to learn from the best practices of high-performing nations, Duncan praised the adoption of Common Core standards, along with teacher and principal recruitment and development requirements in the Race to the Top competition, as critical to improvement. He also called for expanding preschool and redesigning high schools to promote college- and career-ready skills.
John Fensterwald covers state education policy. Contact him and follow him on Twitter @jfenster. Sign up here for a no-cost online subscription to EdSource Today for reports from the largest education reporting team in California.
To get more reports like this one, click here to sign up for EdSource’s no-cost daily email on latest developments in education.
Comments (21)
Comments Policy
We welcome your comments. All comments are moderated for civility, relevance and other considerations. Click here for EdSource's Comments Policy.
Izzy R rosen 2 years ago2 years ago
i want to know her score
Krishna Dronamraju 5 years ago5 years ago
The commonly held popular assumption that USA is leading in all accomplishments is misleading and incorrect.
Replies
Brad Higgins 4 years ago4 years ago
That’s because Jimmy Carter founded the Department of Education which started dumbing down American students to match the rest of the world.
That’s why I posted I would love to see these test results 10 years prior to Department of educations formation.
I think this would show a clear-cut path as to why United States students declined in their education.
William 7 years ago7 years ago
American student test scores began to decline when calculators were put into the classrooms: Calculators have taken away thinking which applies to all subjects.
Also, in the classrooms we do not teach so that students will remember, and we do not hold students accountable for what we have taught them. For the solution to those problems see Curve of Forgetting on Waterloo U web site.
Ken Holtzclaw 7 years ago7 years ago
So, in 1979, when the department of education was created, how did American students rank compared to other nations?
Margo Sommer 9 years ago9 years ago
I’m looking for data comparing U.S. student test scores to those of students in other countries going back to the 60s. I believe that in the mid 60s, we were doing well, but I can’t find any data to support my belief. Can someone help me? Thanks.
Jeff Camp 10 years ago10 years ago
The PISA test results are important partly because they offer an opportunity to remind America that kids in other countries are smart, too. The big pattern, as always, is that PISA scores and statistics of broad economic well-being seem to walk together. Anyone reading this blog probably believes in their bones, as I do, that this is more than mere correlation. Places that make education work well for lots of students enjoy broad economic success over … Read More
The PISA test results are important partly because they offer an opportunity to remind America that kids in other countries are smart, too.
The big pattern, as always, is that PISA scores and statistics of broad economic well-being seem to walk together. Anyone reading this blog probably believes in their bones, as I do, that this is more than mere correlation. Places that make education work well for lots of students enjoy broad economic success over time. If you have a broad view of time, education pays for itself. How awful that our economy’s commitment to education has faded over time. http://edsource.org/states-in-motion?=7
The PISA test should serve as assurance that our bones are right. Education matters, and we shouldn’t be complacent or stingy about our responsibility to provide it to the next generation.
navigio 10 years ago10 years ago
Doug, how have our (and international) tests addressed the question of academic language vs social language. One of the problems here seems to be that even native speakers are not always proficient in academic english, even though english is their only language. That lack of academic proficiency can obviously also exist for english learners. It seems in topics like even math or science or history, when we need to use complex sentences and concepts to … Read More
Doug, how have our (and international) tests addressed the question of academic language vs social language. One of the problems here seems to be that even native speakers are not always proficient in academic english, even though english is their only language. That lack of academic proficiency can obviously also exist for english learners. It seems in topics like even math or science or history, when we need to use complex sentences and concepts to frame a problem or issue, that we end up likely measuring academic language proficiency rather than math or science or history. The link John provided in his response to Suz touches on this point. In terms of addressing this in the educational process, I think we ignore it completely for non-ELs in CA and instead use income level as somewhat of a proxy for that situation. Unfortunately, when we do that, we may not actually be focusing on that skill when we try to address the issue. I wonder how much of the ‘gaps’ described on these (and our) tests are a function of this simple fact.
Replies
Doug McRae 10 years ago10 years ago
Navigio: Traditionally our state tests (and national tests within the US) have by-passed the distinction of academic language vs social language by saying that academic language is part-and-parcel of all content area skills. In other words, for example, math tests include academic language in the skill set needed for achievement in mathematics, likewise for science and history/social science. For international tests, I don't know enuf about the nitty gritty ways they attempt to deal with language … Read More
Navigio:
Traditionally our state tests (and national tests within the US) have by-passed the distinction of academic language vs social language by saying that academic language is part-and-parcel of all content area skills. In other words, for example, math tests include academic language in the skill set needed for achievement in mathematics, likewise for science and history/social science.
For international tests, I don’t know enuf about the nitty gritty ways they attempt to deal with language differences from country-to-country to address your question. But, I will offer an observation regarding international comparisons like TIMSS and PISA, and that is that the sampling problems attempting to get comparable samples from many many very demographically different populations are huge, and thus any comparisons among countries are soft at best before one even gets to content questions like you ask. A good example of the sampling problems is including Shanghai/China as a “country” in the display of PISA results, with the clear effect that differential enrollment policies for provincial Chinese public schools have on who gets tested as part of a PISA data collection in China. To some extent, those kinds of non-comparable sampling problems affect all international comparisons for academic achievement data, and even affect comparability of state-to-state NAEP data for that data collection within the US. So, from a large scale assessment designer prespective, I admire the challenges that the folks doing TIMSS and PISA face, but I have to take the actual results with a large grain of salt and ask the same kind of questions that Mockler asked above.
Suz 10 years ago10 years ago
A quick search shows that 83% of Ontario residents report that English is their first language. Childhood poverty rates in Ontario have been on a steep decline since 2008 dropping from 15% to 13.8% thanks to increases in the minimum wage and bumps to child benefits.
I find it rather hard to believe that these are “similar demographics”.
Replies
John Fensterwald 10 years ago10 years ago
The EL rate is actually 25 percent, Suz, same as CA. You are right: Ontario does a much better job reducing and ameliorating the impact of child poverty.
Skeptic 10 years ago10 years ago
Not to be picky but comparing Ontario to CA for ELL is like comparing “pommes and oranges”. 10% of Ontarians list French as their native language and many parts of Ontario are under the French Language Services Act (French is an official language in Education).
el 10 years ago10 years ago
Our ELL students in California tend to come from families that aren’t literate in any language. It’s a much different and larger problem than that they happen to speak Spanish at home.
CarolineSF 10 years ago10 years ago
What Schleicher says doesn't jibe with figures I've seen showing the U.S. with the second-highest child poverty rate in the developed world (behind only Romania), far higher than other nations. I know it's a lot of work, but it seems like a specialty resource like EdSource Today could and should shed a lot of light by avoiding much-reviled "he said/she said" journalism and looking up the facts behind some of these claims. The assertion that our … Read More
What Schleicher says doesn’t jibe with figures I’ve seen showing the U.S. with the second-highest child poverty rate in the developed world (behind only Romania), far higher than other nations.
I know it’s a lot of work, but it seems like a specialty resource like EdSource Today could and should shed a lot of light by avoiding much-reviled “he said/she said” journalism and looking up the facts behind some of these claims. The assertion that our students are substandard has, as we all know, been a major talking point for decades for the dominant faction in the education policy debates.
In that area, it would be interesting to see the documentation for that last paragraph, claiming that our wealthier students are substandard as well. It’s a big talking point in “reform” sector PR.
Replies
John Fensterwald 10 years ago10 years ago
Caroline: As Doug McRae and John Mockler have noted, international comparisons are fraught with challenges. (Doug, does the 6,100 student sample for the entire US for PISA make subgroup and socioeconomic comparisons even more risky?) That said, for your comparison, turn to page 44 of the massive PISA study Excellence Through Equity where you will see a comparison of nations by quartile based students' socioeconomic status. It shows that the quarter wealthiest students in the United … Read More
Caroline: As Doug McRae and John Mockler have noted, international comparisons are fraught with challenges. (Doug, does the 6,100 student sample for the entire US for PISA make subgroup and socioeconomic comparisons even more risky?)
That said, for your comparison, turn to page 44 of the massive PISA study Excellence Through Equity where you will see a comparison of nations by quartile based students’ socioeconomic status. It shows that the quarter wealthiest students in the United States would have ranked 32 in the world with peers in other nations in math. (It begs the question how you compare the wealthiest students in Denmark, Croatia and Vietnam. I haven’t had time to read it but the publication appears to delve into many of the issues. Fascinating issue, with data that are often twisted.)
Doug McRae 10 years ago10 years ago
John: Yup, 6100 is not a large number when one breaks it down into multiple subgroups and tries to make comparisons. But the bigger variation comes from differing definitions for SES from country-to-country. I'm sure the folks working on PISA computed confidence bands for their subgroup data, which one probably will find if one digs deep enuf into the nitty gritty of the report (I haven't done that) but the bottom line is for a study … Read More
John:
Yup, 6100 is not a large number when one breaks it down into multiple subgroups and tries to make comparisons. But the bigger variation comes from differing definitions for SES from country-to-country. I’m sure the folks working on PISA computed confidence bands for their subgroup data, which one probably will find if one digs deep enuf into the nitty gritty of the report (I haven’t done that) but the bottom line is for a study with limited sample sizes the confidence bands will be pretty wide and that means very little room for high confidence statements on differences for subgroup data from country-to-country. I.E., interpret the results with a large grain of salt . . . . .
CarolineSF 10 years ago10 years ago
If this is true: "Richard Rothstein, a researcher with the Economic Policy Institute, and Stanford University education professor Martin Carnoy, both critics of international comparisons, wrote that more poor students in the United States take the exam than in other nations, skewing the results and that “threats to the nation’s future prosperity come much less from flaws in our education system” than from the nation’s failure to deal with unemployment, poverty and inequality." ... yet Arne Duncan … Read More
If this is true:
“Richard Rothstein, a researcher with the Economic Policy Institute, and Stanford University education professor Martin Carnoy, both critics of international comparisons, wrote that more poor students in the United States take the exam than in other nations, skewing the results and that “threats to the nation’s future prosperity come much less from flaws in our education system” than from the nation’s failure to deal with unemployment, poverty and inequality.”
… yet Arne Duncan says 79 percent of children in Vietnam live in poverty, does that mean that the students who take the test in Vietnam do not represent the socioeconomics of the general population?
John F., can you please reconcile this for us so we readers aren’t confused by these apparently conflicting statements? Thanks!
Replies
John Fensterwald 10 years ago10 years ago
Not sure I can explain it all. One can always select a county to make a point, such as Vietnam, that has overcome disadvantages. Rothstein/Carnoy and Andreas Schleicher, OECD Deputy Director for Education, disagree over the role of socioeconomic factors. You can follow some of their back-and-forth arguments over the past year. Some of it gets pretty technical. However, Schleicher said today on NPR today that the poverty rate for US students is about average compared … Read More
Not sure I can explain it all. One can always select a county to make a point, such as Vietnam, that has overcome disadvantages.
Rothstein/Carnoy and Andreas Schleicher, OECD Deputy Director for Education, disagree over the role of socioeconomic factors. You can follow some of their back-and-forth arguments over the past year. Some of it gets pretty technical.
However, Schleicher said today on NPR today that the poverty rate for US students is about average compared with OECD. A detailed analysis of US scores by the OECD notes that poverty has a bigger impact on US scores than in other OECD nations. In other words, other nations do a better job education poor kids than the US (see page 28) which — me talking here — could be attributed to providing universal preschool or better health care to the poor or assigning the best teachers to work with them. Schleicher says comparing scores between Ontario, Canada, and the United States, with similar demographics, is revealing. Ontario has excelled in international tests over the past decade.
I can’t put my fingers on the reference, but today’s PISA results note that wealthier US students lag behind their counterparts in other nations as well.
el 10 years ago10 years ago
Is there a cite besides Arne Duncan for the "79 percent of children in Vietnam live in poverty"? Google gives me a number more like a third. The only way I can find 78 percent is in the northern, mountainous regions. (I sadly suspect that in the USA we also have regions with a child poverty rate this high.) http://www.unicef.org/vietnam/children.html In addition, in Vietnam, "Disparities persist in education with about 75 per cent of urban children … Read More
Is there a cite besides Arne Duncan for the “79 percent of children in Vietnam live in poverty”? Google gives me a number more like a third. The only way I can find 78 percent is in the northern, mountainous regions. (I sadly suspect that in the USA we also have regions with a child poverty rate this high.)
http://www.unicef.org/vietnam/children.html
In addition, in Vietnam, “Disparities persist in education with about 75 per cent of urban children attending pre-school compared with only 51 per cent of those in rural areas.”
This would substantially skew their outcomes up.
In the United States, our nationwide child poverty number seems to be just a hair under 25%.
John Fensterwald 10 years ago10 years ago
I’ll see if I can track that, el.
john mockler 10 years ago10 years ago
Just how many US students took this test? What was the content they were suppose to know? Who says that is the best content to learn? How does this content tested align with current standards in each of the states?
After you study French I will give you a Spanish test and then headline what a failure you have become